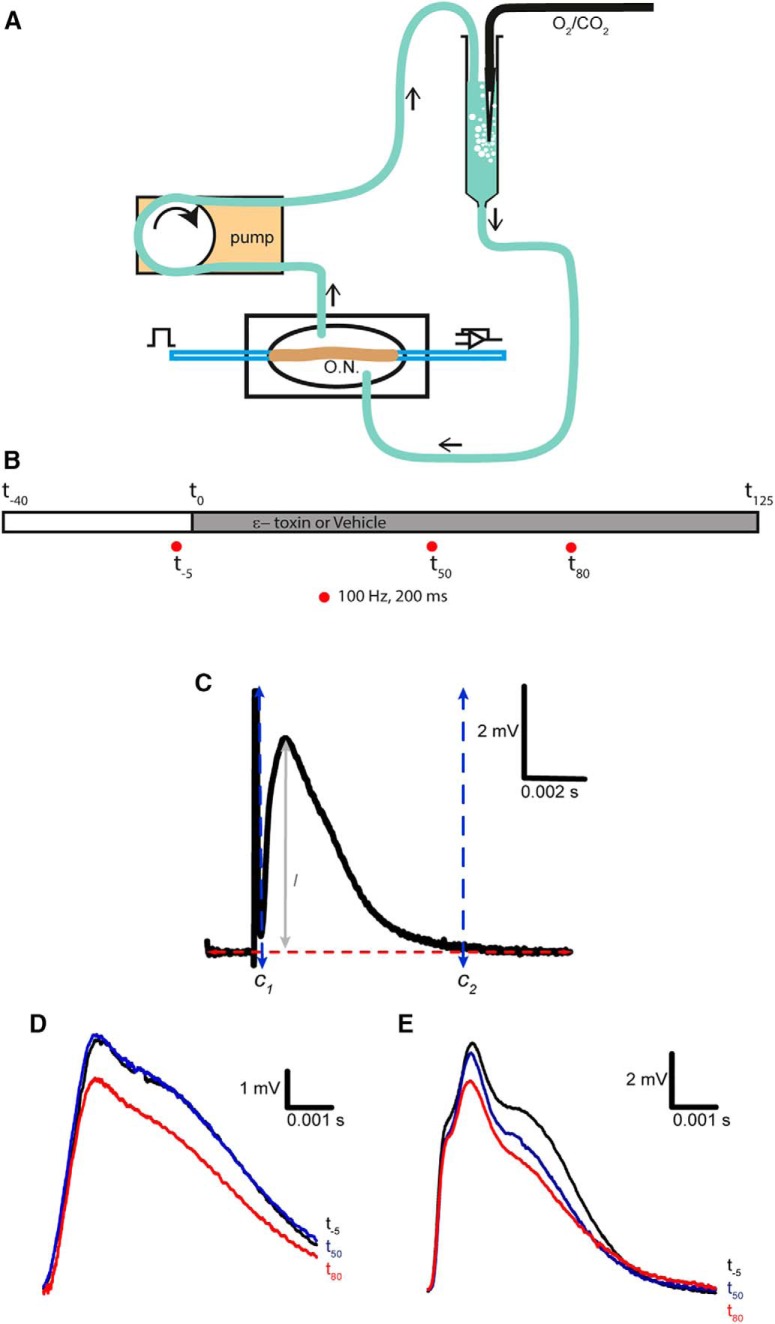
Figure 1.
Recording CAPs from mouse optic nerve. A, Set-up diagram, the signal is generated with a stimulator and conveyed into the optic nerve through a suction electrode, then recorded using a second suction electrode and send to the amplifier. At the same time, the recording chamber is perfused with Locke solution, which recirculates to get aerated in carbogen every turn. O.N., optic nerve. B, Time line of experiment. The time was set at 0 once the ε-toxin is added to the recording chamber. Three train stimulations of 100 Hz that lasted for 200 ms were applied to the optic nerve: one before the addition of the ε-toxin (t-5), 50 min later (t50), and a last, 80 min (t80). Before ε-toxin addition, the optic nerve is let 30 min to stabilize to the set-up and Locke solution. C, Settings for CAPs analysis. The axes were placed to calculate individually the amplitude and area of the CAP. C1 and C2 are the axes set at the beginning and at the end of the CAP, respectively. The red line is set at the base level. l determines the maximum amplitude of the CAP. D, CAPs elicited at low-frequency stimulation (0.03 Hz) in control conditions before and after adding 50 µl of PBS (vehicle). At -5 min (black), minute 50 (blue), and 85 min (red). E, In ε-toxin condition, examples of CAPs at the same given times. ε-toxin was added dissolved in PBS. Scale bars are represented in each panel. Stimulus artifact was eliminated manually. Differences in shape and amplitudes of initial CAPs in D, E (black) are not related to the action of the ε-toxin, they represent the variability of recording CAPs of different animals.

