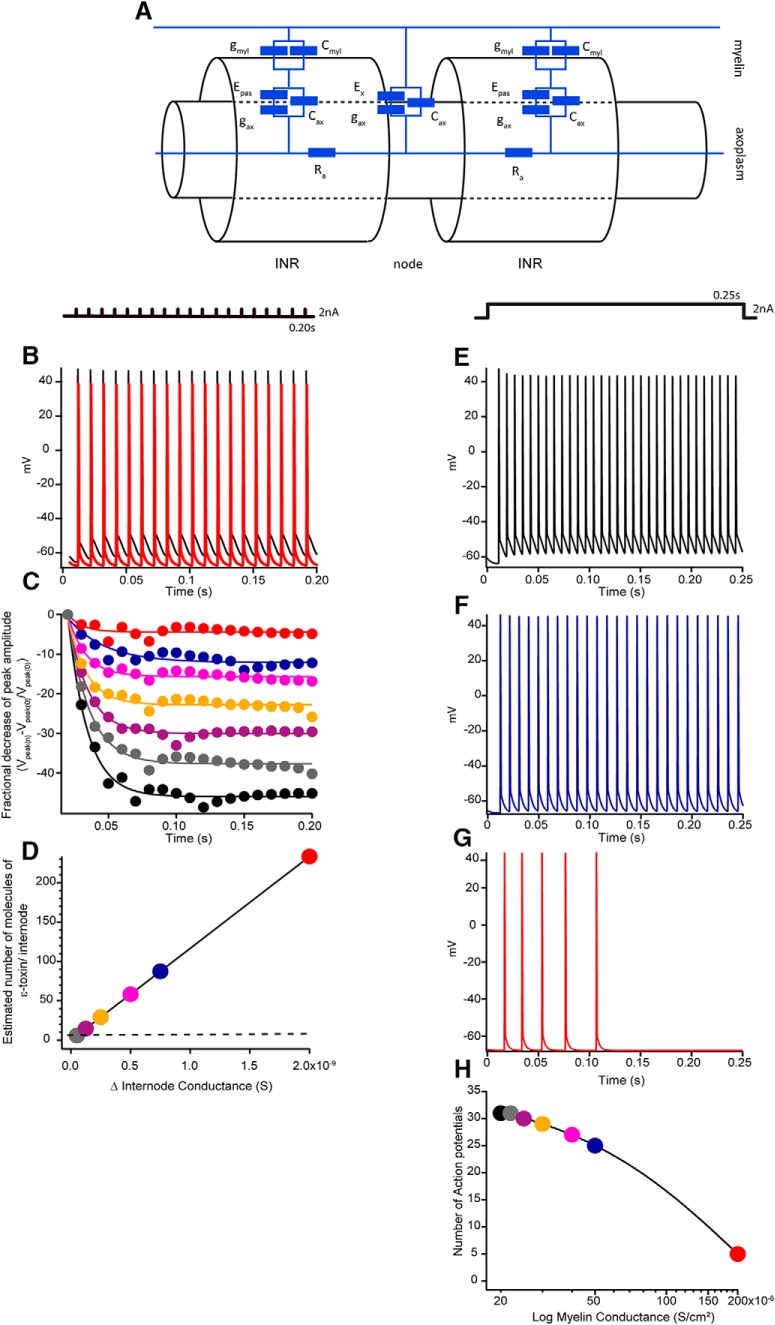
Figure 5.
Computer simulation on a single myelinated fiber with the dimensions of the mouse optic nerve. A, Equivalent circuit of the model corpus callosum axon, which has been adapted from existing models (Richardson et al., 2000; Devaux and Gow, 2008; Kolaric et al., 2013). The axon is divided into two regions, the node and internodal (INR). Nodal membrane potential is represented by Ex and intermodal potential by Epas. The nodal region expresses voltage-dependent conductances, as well as leak current (gax) and capacitance (Cax). The axolemma underlying the myelin also has these properties (gax and Cax), but the myelin contributes an additional resistive (gmyl) and capacitative barrier (Cmyl). The passive current across the membrane is the sum of gmyl and gax. Axon resistance (Ra) is constant throughout the model. Effect of the increasing gmyl on simulated action potentials during 100 Hz train. B, Nineteen action potentials elicited in a 2 nA pulses train stimulation of 200 ms as represented above. In black, are action potentials of control conditions, with normal conductance (2 × 10⁻⁵ S/cm2) and in red, an increase of magnitude by 10 in conductance (2 × 10⁻⁴ S/cm2). C, Representation of the fractional decrease of the peak amplitude of the 2-nA 100 Hz train stimuli at a different myelin conductance. Control conditions, 2 × 10⁻⁵ S/cm2 (black), 2.2 × 10⁻⁵ S/cm2 (gray), 2.5 × 10⁻⁵ S/cm2(purple), 3 × 10⁻⁵ S/cm2 (yellow), 4 × 10⁻⁵ S/cm2 (fuchsia), 5 × 10⁻⁵ S/cm2 (blue), and 2 × 10⁻⁴ S/cm2 (red). D, Linear relationship between the increase of conductance of a single internode and the estimated number of molecules of the ε-toxin per internode. Few tens of molecules would increase the myelin conductance with a dramatic consequence on the amplitude decay as shown in C. E, Action potential triggered by a sustained 250 ms pulse of 2 nA, as shown above, at a control condition with a conductance, 2 × 10⁻⁵ S/cm2. F, In blue, action potentials triggered at a conduction of 5 × 10⁻⁵ S/cm2, the frequency of firing is decreased. G, In red, action potentials triggered at a conduction of 2 × 10⁻⁴ S/cm2, the frequency decreases until no action potentials can be elicited. H, Plot of the calculated number of action potentials triggered versus myelin conductance. Code color as C, D. As the conductance of myelin increases, the number of action potentials elicited is decreased.

