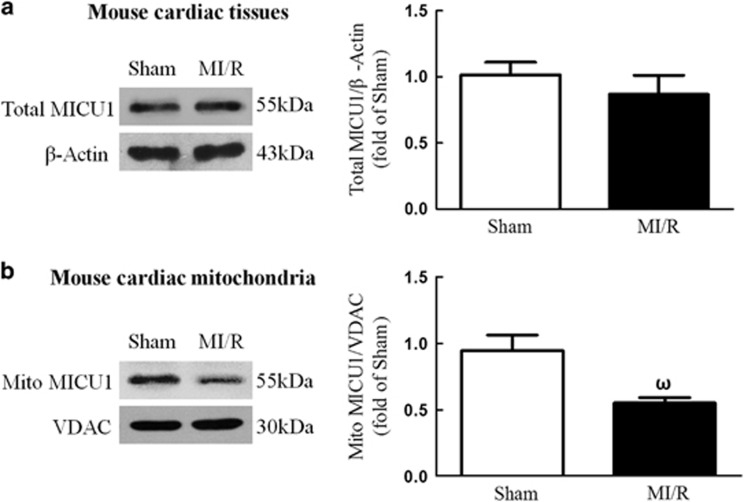
Figure 1.
MICU1 responded to MI/R injury. (a) Representative western blot images showing total MICU1 expression using β-actin as loading control in the left panel; intensities of total MICU1 relative to β-actin in the right panel. (b) Representative western blot images showing mitochondrial MICU1 expression using VDAC as loading control in the left panel; intensities of mitochondrial MICU1 relative to VDAC in the right panel. Mito, mitochondria; VADC, voltage-dependent anion channel. Presented values are means±S.E.M. N=6–8/group. ωP<0.05 versus sham

