Figure 5.
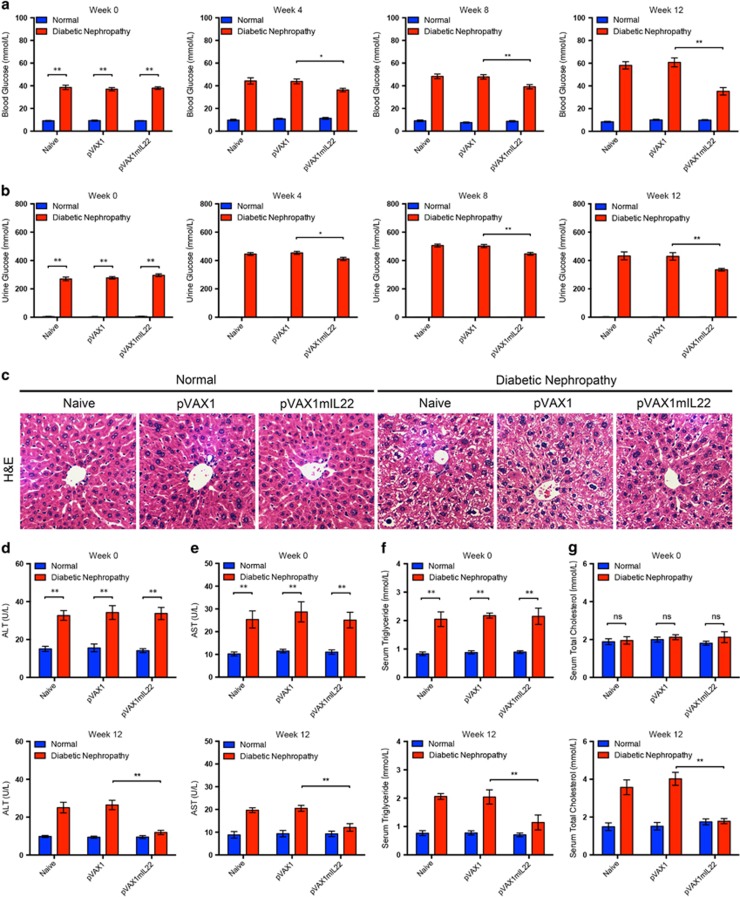
Improved glycemic and metabolic control in diabetic mice after IL-22 gene therapy. (aandb) Blood glucose levels and urine glucose levels 0, 4, 8, and 12 weeks after IL-22 gene therapy. (c) Representative micrographs of H&E staining to detect liver histopathological alterations. Original magnification: × 200. (dand e) Serum levels of ALT and AST before and after IL-22 gene therapy. (f and g) Serum levels of triglyceride and total cholesterol before and after IL-22 gene therapy. N=5; *P<0.05; **P<0.01. The time point of the initiation of IL-22 gene therapy was defined as week 0. NS, no significance

