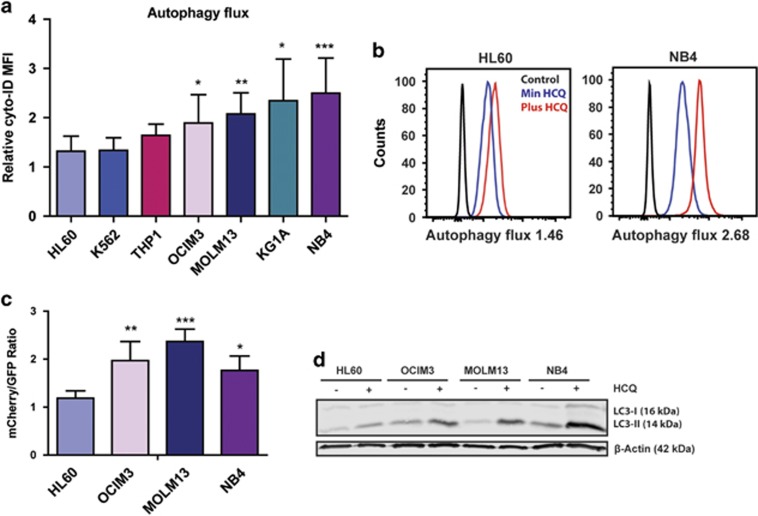
Figure 1.
Variation in autophagy flux between different leukemic cell lines. (a) Relative accumulation of autophagosomes after overnight treatment with 20 μM HCQ measured by staining with Cyto-ID in a panel of leukemic cell lines (N=7). (b) Representative FACS plots showing mean fluorescent intensity of Cyto-ID, with or without HCQ treatment. (c) mCherry/GFP ratio in a panel of leukemic cell lines transduced with mCherry-GFP-LC3. (d) Representative western blot of LC3-II accumulation after HCQ in cell lines, β-actin was used as loading control. Error bars represent S.D.; *, ** or *** represents P<0.05, P<0.01 or P<0.001, respectively

