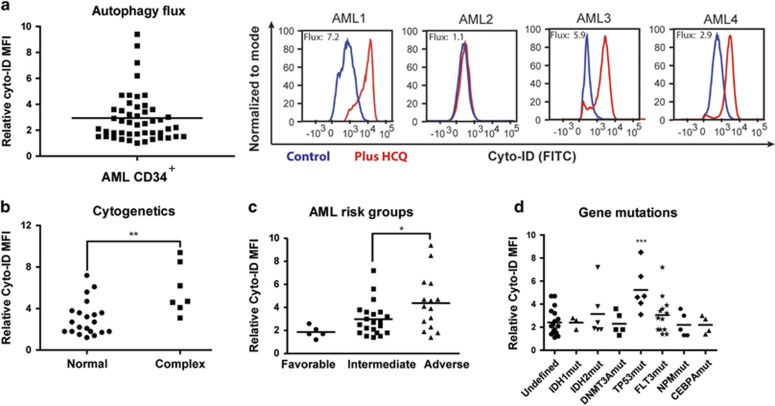
Figure 3.
Variation in autophagy levels between different AMLs, independent of the differentiation status. (a) Left panel, for autophagic flux measurements (relative Cyto-ID accumulation) in AML CD34+ blasts (n=51), AML CD34+ cells were cultured for 3 days on MS5 stromal layer before overnight incubation with 20 μM HCQ. Right panel, representative FACS plot showing the accumulation of Cyto-ID after treatment with HCQ. (b) Autophagy flux in AMLs with normal karyotype versus complex cytogenetic abnormalities. (c) Autophagy flux in AMLs according to the various ELN risk groups. (d) Autophagy flux in AML CD34+ cells according to commonly mutated genes in AML. Error bars represent S.D.; *, ** or *** represents P<0.05, P<0.01 or P<0.001, respectively

