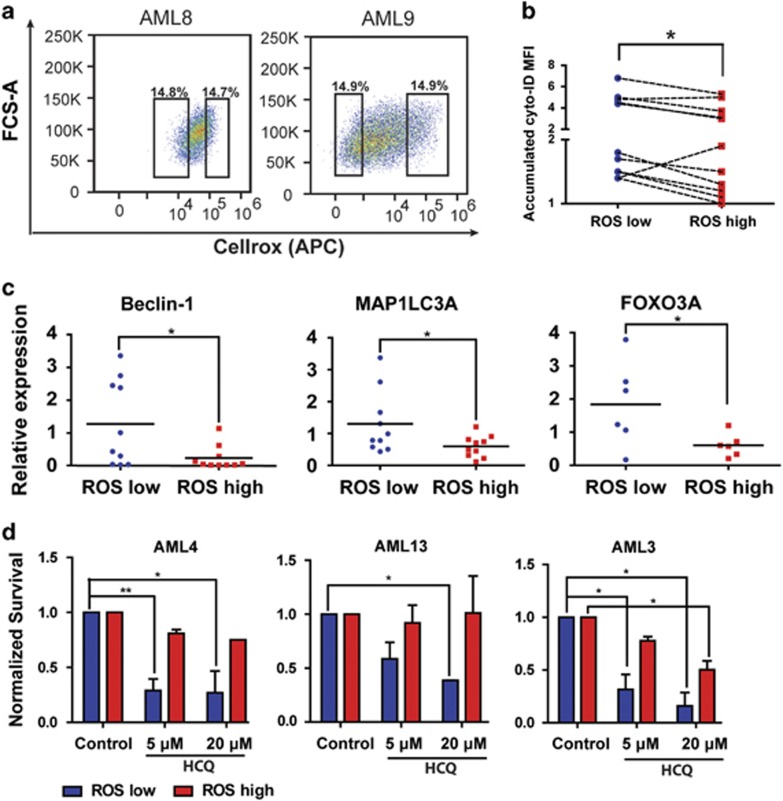
Figure 6.
Autophagy is higher in the ROSlow population of AML blasts. (a) Representative FACS plots showing CellROX staining in freshly isolated AML CD34+ cells. (b) Relative Cyto-ID levels in ROShigh and ROSlow fractions of AML CD34+ cells (n=11). (c) Gene expression of Beclin-1 and MAP1LC3A in freshly sorted AML CD34+ROShigh and CD34+ROSlow cells. (d) Survival of FACS-sorted ROShigh and ROSlow AML CD34+ cells, cultured for 3 days on an MS5 stromal layer before treated for 48 h with different concentrations HCQ. Error bars represent S.D., * or ** represents P<0.05 or P<0.01 respectively

