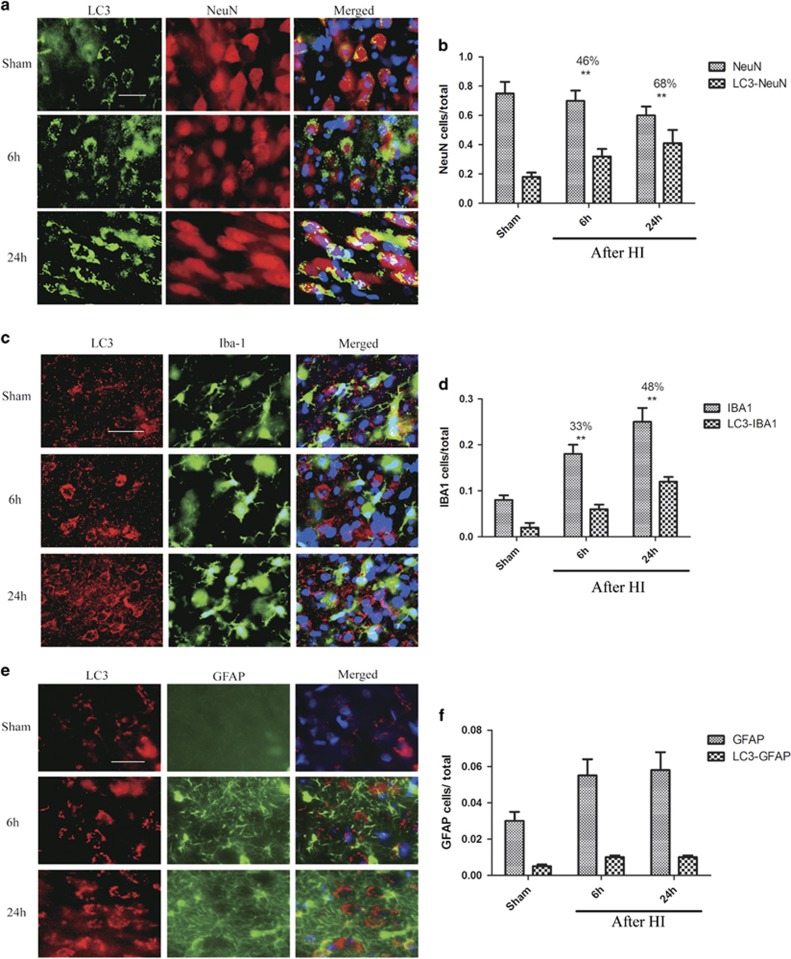
Figure 3.
Autophagosome accumulation in cortex after HI is cell type specific. Images of cortical brain sections stained with antibodies against LC3 and (a) the neuronal marker NeuN, (c) the microglial marker IBA1, and (e) the astrocyte marker GFAP. Merged images also include DAPI nuclear staining (blue). Scale bar=50 μm. Quantification of cells positive for each marker and cells double-positive for LC3 along with (B) NeuN (**P<0.01), (d) IBA1 and (e) GFAP, normalized to the total cell number. The percentages of LC3-NeuN double-positive cells versus single-positive cells are indicated at 1 d. Data are presented as mean±S.D. (n=3 piglets; at least 1000 cells were quantified per piglet per experiment)

