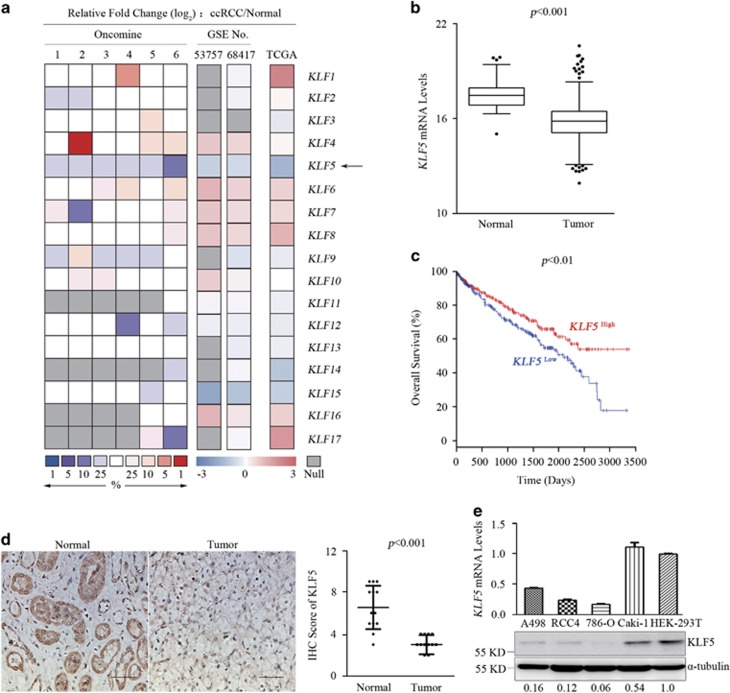
Figure 1.
KLF5 expression is suppressed in ccRCC patients. (a) The heatmap showing the fold changes of mRNA expression levels of KLF family members compared ccRCC patients with normal people from the Oncomine, GEO and TCGA KIRC data sets. Arrow indicates relative change of KLF5. Oncomine data sets include: 1, Beroukhim renal; 2, Cutcliffe renal; 3, Gumz renal; 4, Jones renal; 5, Lenburg renal and 6, Yusenko renal. GSE53757 and GSE68417 are numbers of GEO data sets. (b) Boxplot of mRNA levels of KLF5 in tissues of normal people (n=72) and ccRCC patients (n=531) from TCGA KIRC data sets. Two-tailed Student’s t-test, P<0.001. (c) Kaplan–Meier analysis of overall survival of ccRCC patients (n=531) segregated by low or high expression of KLF5 from TCGA KIRC data sets. Log-rank test, P<0.01. (d) Representative IHC staining images (left) and IRS scores (right) of KLF5 expression of tumor or adjacent normal tissues from ccRCC patients (n=13). Scale bar, 50 μm. Student’s t-test, P<0.001. (e) qPCR (up) and western blots (down) for the mRNA and protein levels of KLF5 of indicated ccRCC and HEK-293T cells. Expression levels of KLF5 in ccRCC cells were normalized to that in HEK-293T cells

