Figure 1.
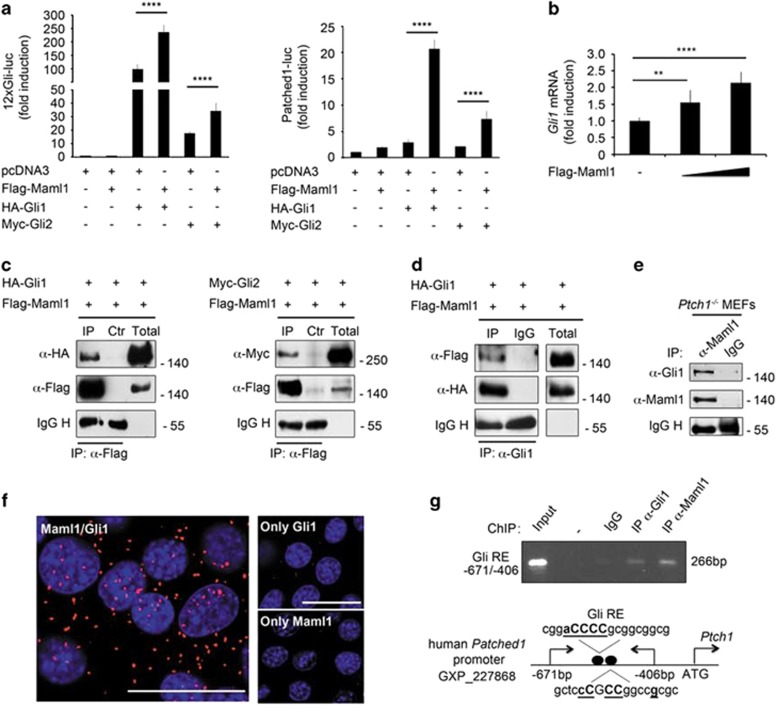
Maml1 interacts with Gli proteins and sustains Gli-mediated transcription. (a) Luciferase assay in HEK293T cells transfected with 12xGli-luc (left panel) or Patched1-luc (right panel) reporter and different combinations of plasmids encoding for Maml1, Gli1 and Gli2 as indicated. Luciferase activity is expressed as fold induction relative to pcDNA3 alone (empty control). (b) Endogenous Gli1 mRNA levels evaluated by qRT-PCR in NIH3T3 cells transfected with increasing amounts of Maml1, compared with pcDNA3. (c) Coimmunoprecipitation (co-IP) experiments performed in HEK293T cells, transfected with expression vectors encoding for the indicated tagged proteins and immunoprecipitated with anti-Flag without (IP) or with (Ctr) blocking peptide. The interaction with Gli1 and Gli2 was revealed with anti-HA (left panel) or anti-Myc (right panel), respectively. (d) Reciprocal co-IP was performed by using anti-Gli1 antibody or control mouse antisera (IgG) and the interaction with Maml1 was detected with anti-Flag. Gli1 and Maml1 protein levels in total cell lysates are shown. (e) Ptch1−/− MEFs were lysed and immunoprecipitated with Maml1 antibody or control rabbit antisera (IgG) and the blot was reprobed with Gli1. (f) Representative immunofluorescence images of endogenous Gli1/Maml1 interaction in NIH3T3 cells analyzed by in situ proximity ligation assay (PLA). Negative controls lacking one of the primary antibodies. No significant fluorescent signal was detected in NIH3T3 cells incubated with only one primary antibody (only Gli1; only Maml1). Single plane confocal images were captured using a 60 × oil objective. Protein complexes were visualized in red; nuclei were DAPI labeled (blue). Scale bar: 100 μm. (g) ChIP assay in HEK293T cells. PCR was performed using primers that amplify Gli consensus binding sites on human Ptch1 promoter (upper panel) as shown in schematic representation (lower panel). According to Genomatix, basepairs in bold and underlined are important, since they appear in a position where the matrix exhibits a high conservation profile (ci-value>60); basepairs in capital letters denote the core sequence used by MatInspector. Dark circles represent predict binding sites. Data reported as mean±S.D. **P≤0.01; ****P≤0.0001

