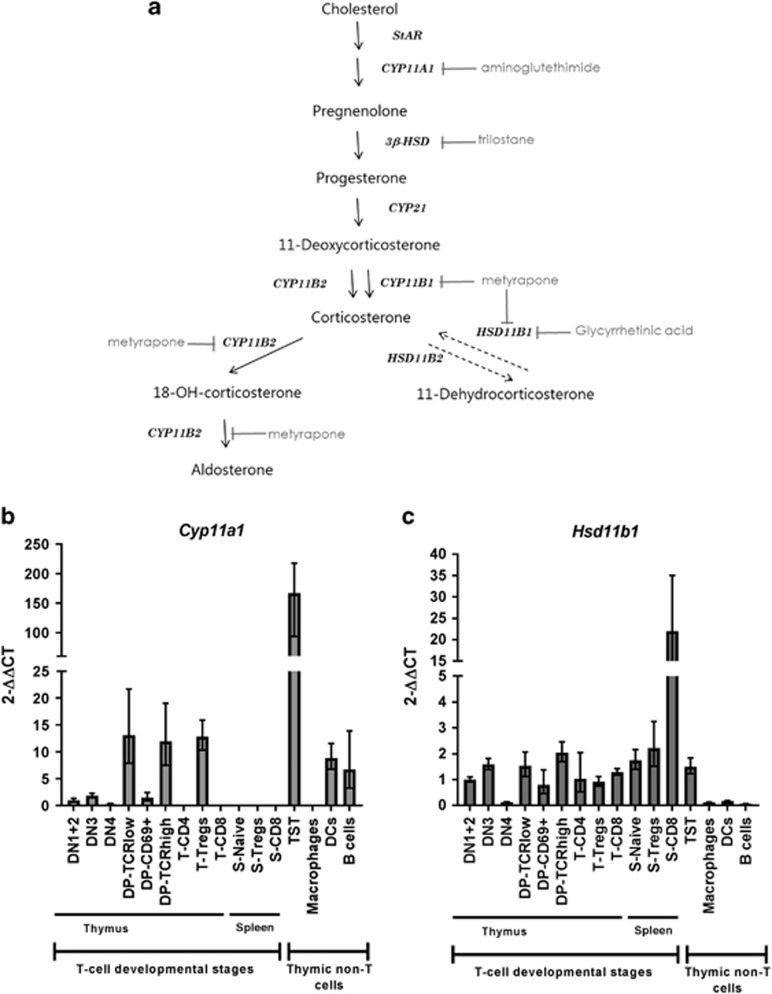
Figure 1.
Differential gene expression of the main GC metabolic enzymes in thymus and spleen. (a) Schematic of the steps in glucocorticoid synthesis. Enzymes are shown in italics and inhibitors are depicted in gray. Solid arrows show de novo synthesis of GC; dashed arrows indicate activation/inactivation from inactive GC to the active form, respectively. Real-time qPCR analysis of Cyp11a1 (b) and Hsd11b1 (c) in different cell types from thymus and spleen of 5–12 weeks old mice. Expression level of each gene is expressed as 2−ΔΔCt (referred to DN1+2 cells relative to Actin). DCs, dendritic cells; S, spleen; T, thymus; TST, enriched thymic stromal tissue

