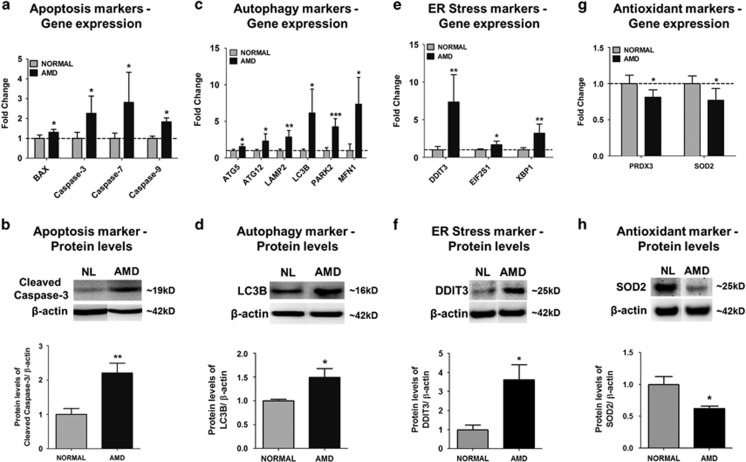
Figure 3.
AMD cybrids showed differential expression levels of apoptosis, autophagy, ER stress, and antioxidant genes at 72 h. To examine the involvement of molecular/cellular pathways in mtDNA-mediated cell death, the gene expression profiles of apoptosis, autophagy, ER stress, and antioxidant markers were measured. (a,c,e,g) Using qRT-PCR analyses, the AMD cybrids showed upregulation of Apoptosis genes (a): BAX (30.8%, P=0.02, n=5), Caspase-3 (125.7%, P=0.03, n=4), Caspase-7 (181.3%, P=0.03, n=4–5), Caspase-9 (82.8%, P<0.001, n=4–5); Autophagy genes (c): ATG5 (54.4%, P=0.02, n=4), ATG12 (130.5%, P=0.03, n=4), LAMP2 (184.5%, P<0.001, n=4), LC3B (513.8%, P=0.01, n=4), PARK2 (326.3%, P<0.001, n=4), MFN1 (741.2%, P=0.02, n=5); and ER stress genes (e): DDIT3 (633.9%, P=0.006, n=4), eIF2α (66.2%, P=0.03, n=4), XBP1 (220.2%, P=0.005, n=4) compared to normal cybrids. AMD cybrids showed downregulation of antioxidant genes (g), PRDX3 (18.8%, P=0.02, n=5) and SOD2 (23.1%, P=0.04, n=3) in AMD cybrids (Supplementary Table S5). (b,d,f,h) Western blot analyses showed upregulated protein levels of Cleaved-Caspase-3 (120.4%, P=0.007, n=5; b), LC3B (49.1%, P=0.04, n=4; d), DDIT3 (261%, P=0.01, n=5; f), and downregulation of SOD2 (38%, P=0.01, n=5; h) in AMD cybrids (Supplementary Table S6). Data are represented as mean±S.E.M., normalized to normal cybrids (assigned value of 1). The endpoint for all experiments was 72 h

