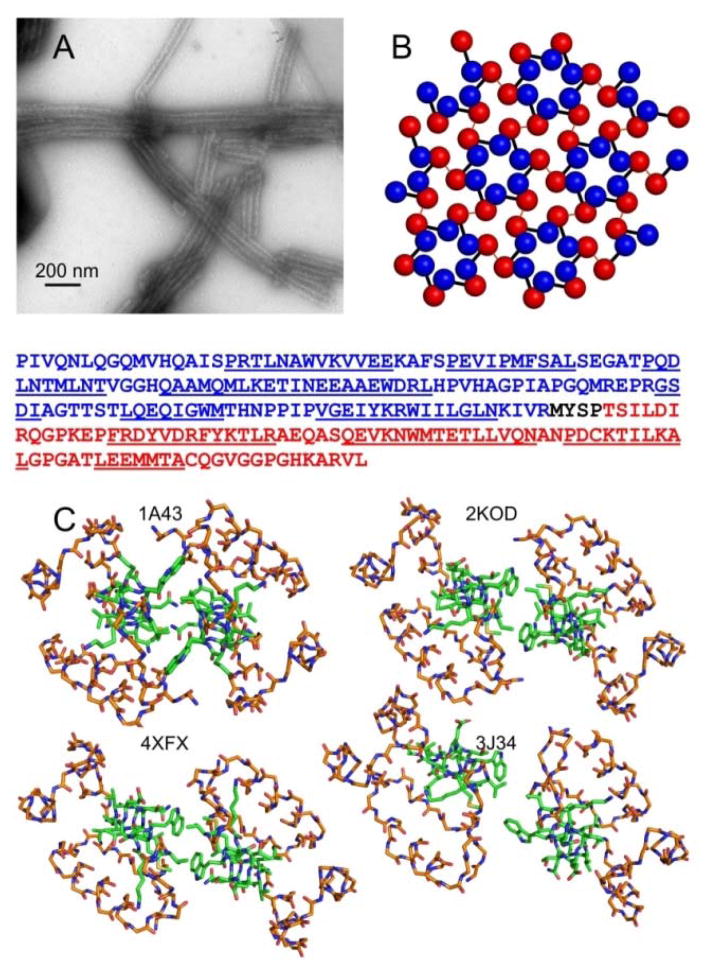
Figure 1.
Diverse dimerization interface structures from crystallography, solution NMR, and cryoEM. (A) TEM image of typical tubular HIV-1 CA assemblies studied by solid state NMR. (B) Ideal CA lattice, with NTD and CTD represented by blue and red spheres, respectively. Black bars connect NTD and CTD of the same CA molecule. Red lines represent intermolecular dimerization interfaces. The CA sequence is shown below panels A and B, with the NTD in blue, the CTD in red, and helical segments underlined. (C) CTD dimer structures from the indicated PDB files, viewed down the two-fold (or approximate two-fold) symmetry axes. Backbone atoms of residues 148–180 and 195–218 are shown, using orange to represent carbon atoms. Backbone and sidechain atoms of residues 181–194 are shown, using green to represent carbon atoms. For PDB 2KOD, the first of 30 NMR-based models is depicted. For PDB 3J34, one of the 12 cryoEM-based dimerization interfaces is depicted.

