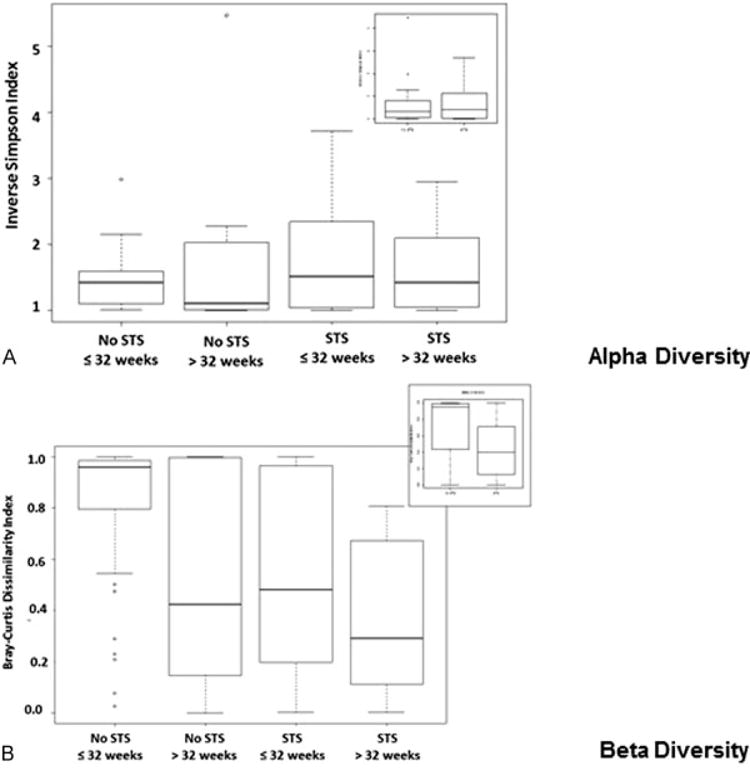
Fig. 4.

Population diversity within STS and non-STS exposure groups. (A) Alpha-diversity in skin to skin (STS) and non-STS-exposed infants. Alpha-diversity within the two groups by STS or non-STS (inset) or the four groups, as measured using relative inverse Simpson index of genus-level phylotypes, 16S rRNA OTUs. The oral flora demonstrates 1–2 abundant taxa diversity among all groups. (B) Beta-diversity in STS and non-STS-exposed infants. Bray-Curtis dissimilarity index beta-diversity among the two groups (inset) reveals increased microbial diversity within the non-STS as compared with the STS group. Further delineation identified that the non-STS group of ≤32 weeks experienced the greatest difference in microbial diversity within the groups. For each box plot, the middle bar represents the median; the outer horizontal lines of the box represent the 25th and 75th percentiles. The dots indicate the values of individual samples.
