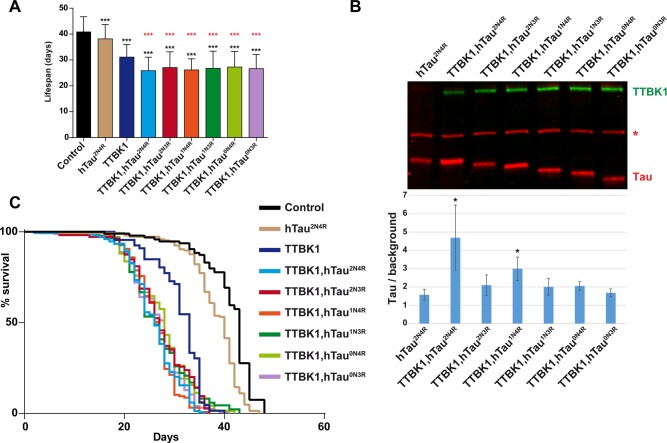
Fig. 3.
TTBK1 toxicity is enhanced by all six hTau isoforms. (A,B) Lifespan and western blot analysis of flies expressing TTBK1 with hTau isoforms, using the inducible n-Syb-Gal4;Gal80[ts] driver. Results are depicted as Kaplan–Meier survival curves (C) (Kaplan and Meier, 1958) and bar graph (A). (A,C) All six hTau isoforms showed significantly shortened lifespan when co-expressed with TTBK1, when compared to control flies (n-Syb-Gal4;Gal80[ts] crossed to the attP landing site strain BL9750). Error bars in (A) indicate mean±s.d.; black asterisks depict pair-wise comparison with control, and red asterisks depict pair-wise comparison with TTBK1 (***P≤0.001; Student's two-tailed t-test; n=3 independent experiments; ≥70 flies). (B) Western blot, using Licor, of fly head extracts after 5 days expression of the transgenes at 29°C. TTBK1 kinase was detected using anti-HA antibody, hTau was detected using a rabbit anti-hTau antibody (asterisk denotes antibody background reactivity to an endogenous Drosophila protein). We observed increased hTau levels in the hTau2N4R and hTau1N4R isoforms when co-expressed with TTBK1. Bar graph in B represents the average value of three independent gels, showing the value of the ratio of Tau/ background. Error bars indicate mean±s.d. and black asterisks depict pair-wise comparison with hTau2N4R.

