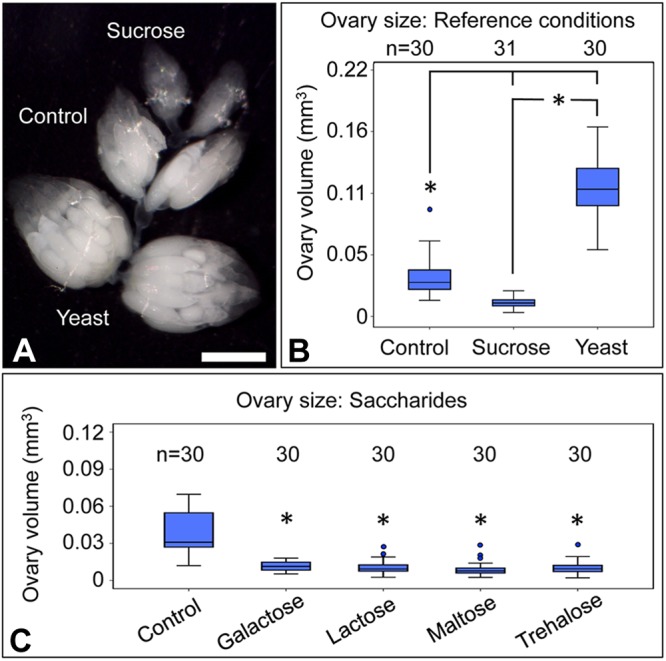
Fig. 3.

Ovary size response to sugar-enriched diets. (A) Image shows examples of ovaries dissected from flies exposed to control, sucrose, and yeast. Scale bar: 0.5 mm. The graphs show quantification of ovary volume after exposure to food enriched in (B) sucrose and yeast and (C) galactose, lactose, maltose, and trehalose. Ovary pairs were dissected in the context of three biological replicates, with 5 flies dissected per condition per replicate. The size of each ovary was measured independently. The sample size (n) for all experimental conditions is included in the figure. Median values are displayed as the middle line within each boxplot, and the boxed areas represent the interquartile range. The box whiskers indicate minimal and maximum values of the dataset, except for the outliers which are shown as solid blue circles. Significance is indicated by asterisks, as according to Kruskal–Wallis ANOVA; *P<0.001.
