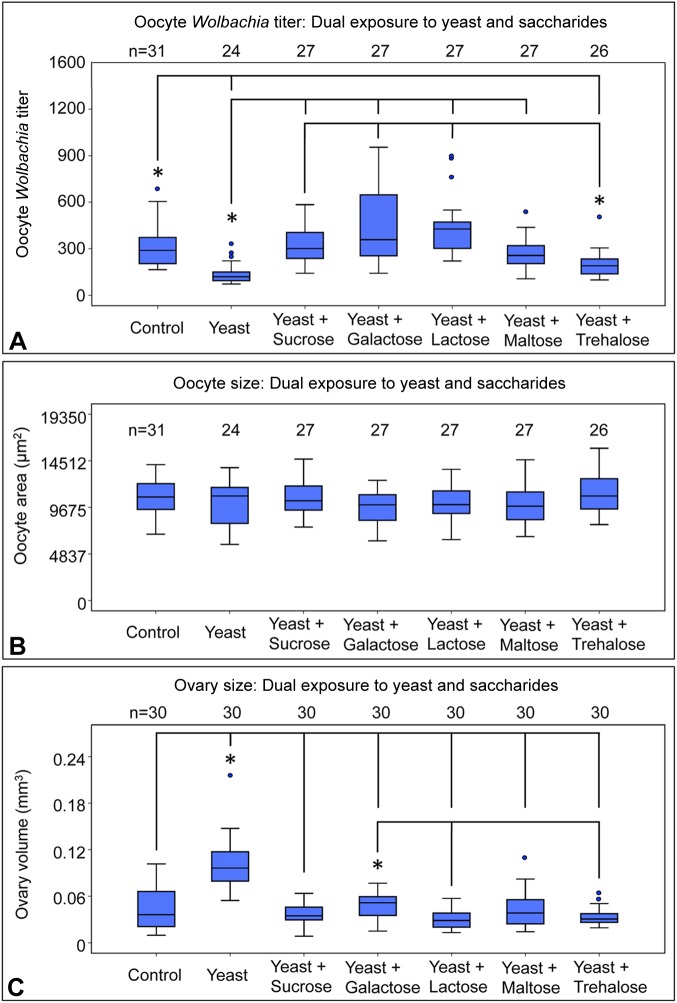
Fig. 6.
Assessing impact of diets dually enriched in yeast and natural saccharides. The sugars co-administered with yeast included: sucrose, galactose, lactose, maltose and trehalose. Graphs represent changes in quantification of (A) oocyte Wolbachia titer, (B) oocyte area, and (C) ovary volume in response to dual feeding conditions. For oocyte Wolbachia titer and oocyte size analyses, three biological replicates of the experiment were performed, 20 flies were dissected per condition per replicate. Stage 10 oocytes were selected randomly for confocal microscopy imaging, then followed up for quantification. For assessment of ovary size, ovary pairs were dissected from 15 flies total per condition, 5 flies per replicate. Each ovary was measured independently. The sample size (n) for all experimental conditions is included in the figure. Median values are displayed as the middle line within each boxplot, and the boxed areas represent the interquartile range. The box whiskers indicate minimal and maximum values of the dataset, except for outliers, shown as solid blue circles. Significance is indicated by asterisks, as according to Kruskal–Wallis ANOVA. Significance values by panel are: (A) Oocyte titer: *P<0.001 with the exception of: control vs yeast + trehalose: P=0.021; yeast vs yeast + maltose: P=0.002; and yeast + trehalose vs yeast + sucrose: P=0.008. (C) Ovary size: *P<0.001 with the exception of: yeast + galactose vs yeast + lactose: P=0.005; and yeast + galactose vs yeast + trehalose: P=0.035.

