Fig. 3.
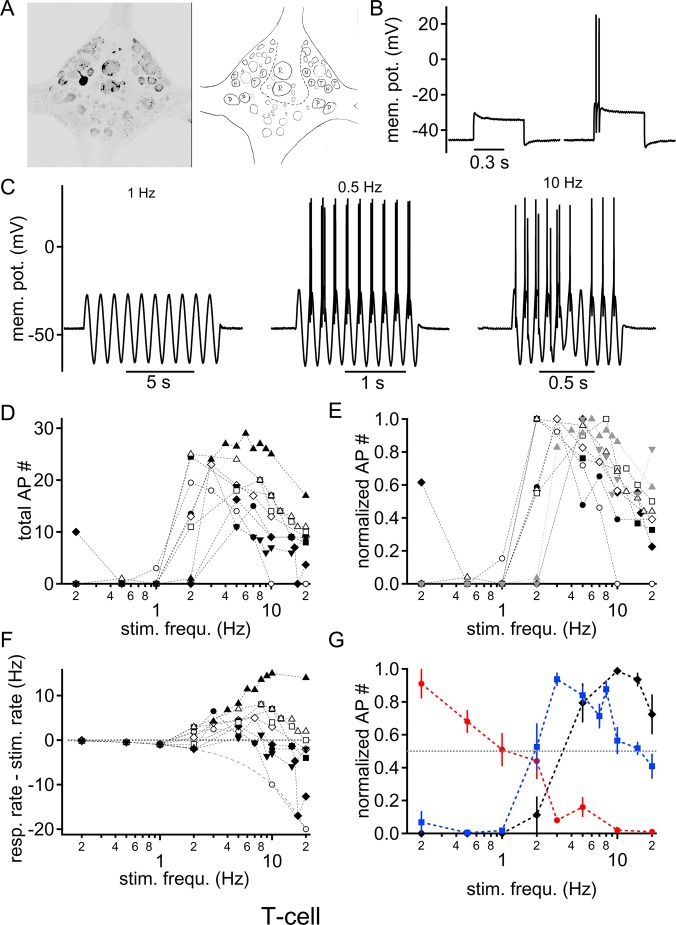
Intrinsic frequency response profile of T cells to sinusoidal current injections. (A) Fluorescent labeling of a recorded T cell was used to identify the cell location post-hoc by comparison to a schematic drawing of the known location of leech sensory neurons. (B) Square pulse current injection just below (left) and above (right) the action potential threshold. The initial burst of action potential is characteristic of T cells. (C) Voltage responses to different sinusoidal stimulation frequencies: left, 1 Hz; middle, 0.5 Hz; right, 10 Hz. (D) Number of supra-threshold responses summed over the 10 sinusoidal cycles as a function of stimulation frequency. Each symbol represents the response of a single cell (n=9). (E) Normalized number of action potentials as a function of stimulation frequency. The dotted horizontal line indicates half maximal firing. Symbols are as in D. (F) Action potential firing rate from which the stimulation rate was subtracted is plotted as a logarithmic function of the stimulation frequency. The dotted zero line indicates the same firing rate as the number of stimulation cycles, hence faithful firing. The solid line represents the zero action potential line, where no supra-threshold response was elicited at any time during stimulation. Symbols are as in D. (G) Normalized action potential firing in response to different sinusoidal stimulation frequencies of injected current for N (red), P (black) and T (blue) cells. Only stimulation frequencies where at least four cells were recorded are presented (mean±s.d.).

