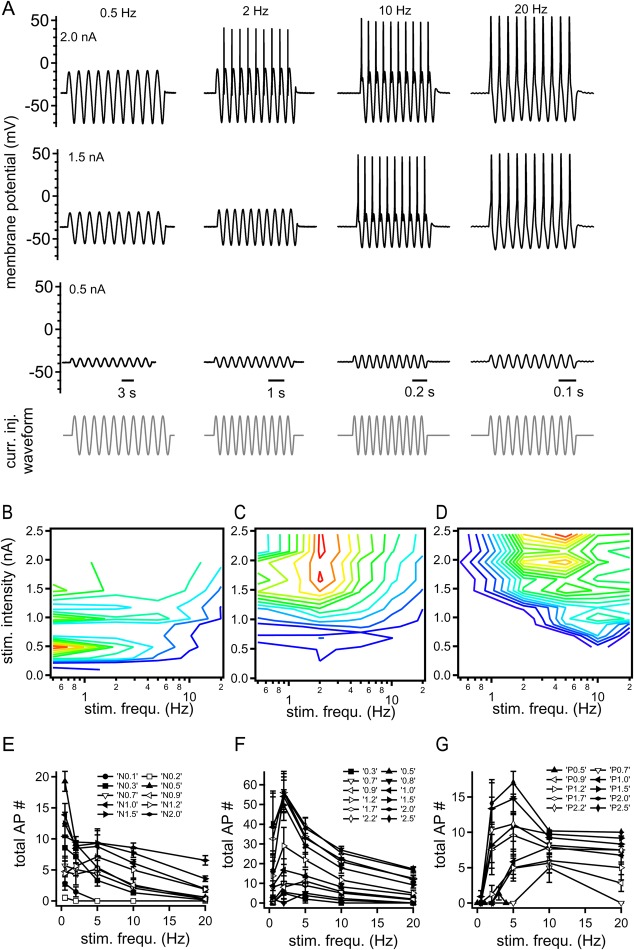
Fig. 4.
Supra-threshold response profiles are different in N, T and P cells, and depend on stimulation intensity and frequency. (A) Sub- and supra-threshold membrane potential responses (black) of a P cell to current injections (grey) of 0.5 Hz (left), 2 Hz (left center), 10 Hz (right center) and 20 Hz (right) at stimulation intensities of 0.2 nA (top), 0.15 nA (middle) and 0.05 nA (bottom). (B-D) Number of action potentials plotted as a function of stimulation intensity and frequency for (B) N, (C) T and (D) P cells. Line color spectrum from dark blue to red represents the number of action potentials from low to high numbers. (E-G) Number of action potentials elicited in response to current injections of different stimulation intensities: (E) N cell: 0.1, 0.2, 0.3, 0.5, 0.7, 0.9, 1.0, 1.2, 1.5 and 2.0 nA (n=4-21); (F) T cell: 0.3, 0.5, 0.7, 0.8, 0.9, 1.0, 1.2, 1.5, 1.7, 2.0, 2.2 and 2.5 nA (n=4-16); and (G) P cell: 0.5, 0.7, 0.9, 1.0, 1.2, 1.5, 1.7, 2.0, 2.2 and 2.5 nA as a function of the stimulation frequency (0.5, 2, 5, 10 and 20 Hz). Error bars represent s.e.m.

