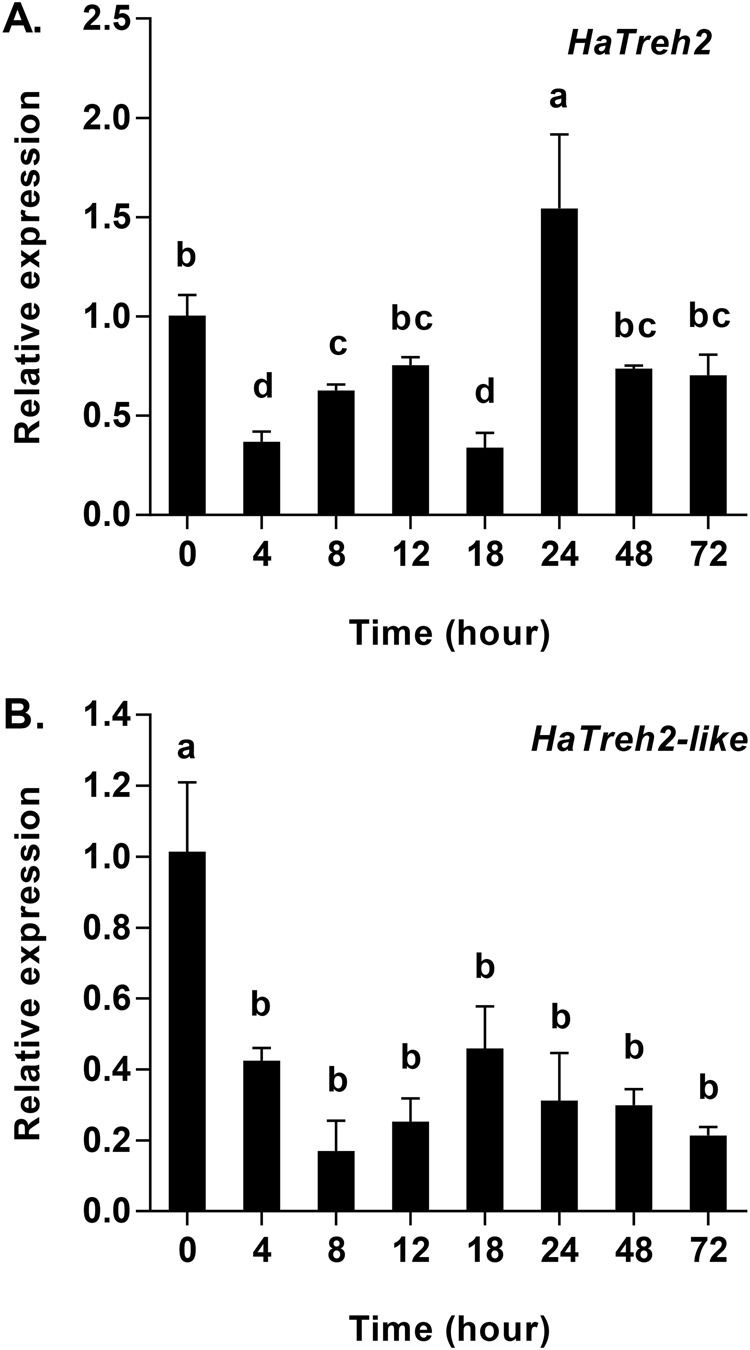
Fig. 4.

Quantitative mRNA expression of two membrane-bound trehalase genes in Harmonia axyridis in response to starvation (0–72 h). (A) mRNA expression of HaTreh2. (B) mRNA expression of HaTreh2-like. Gene expression is relative to the expression of the endogenous control Harp49 (H. axyridis ribosomal protein 49 gene), measured via qRT-PCR. Data are presented as mean±s.d. (n=3). Bars with different letters indicate significant differences (P<0.05; one-way ANOVA test).
