Fig. 1.
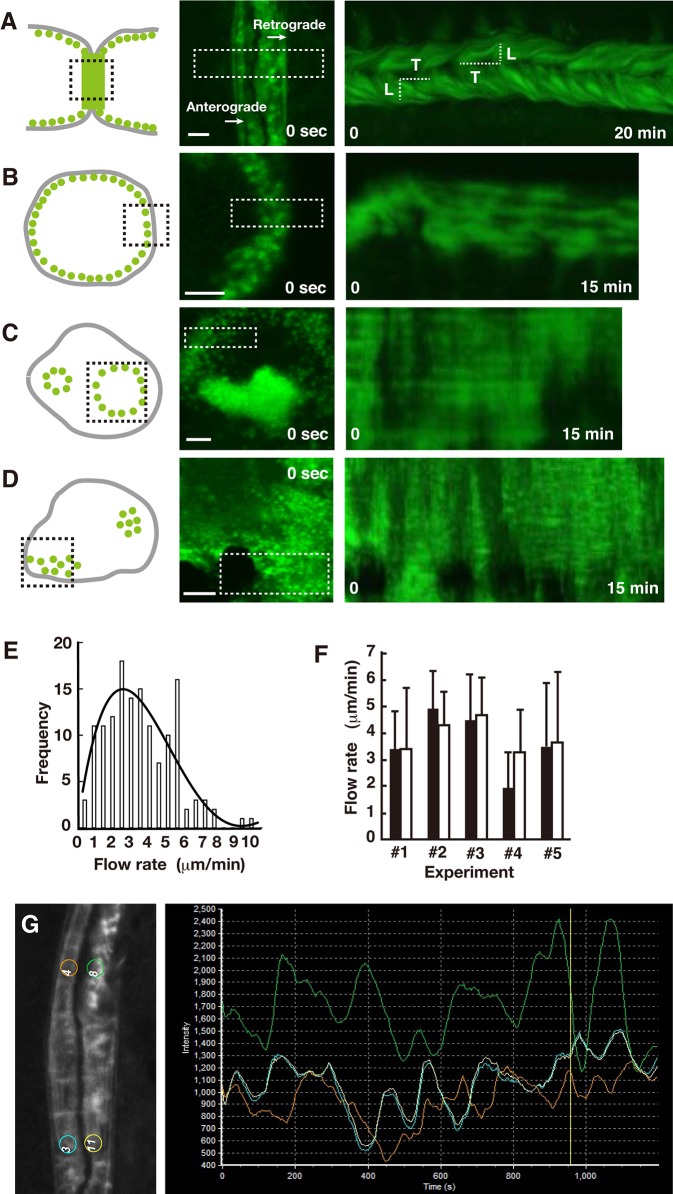
Characteristics of actin dynamics in the ZLS. (A-D) RAW 264.7 cells were transfected with EGFP-actin and used for live-cell imaging. Schematics (left panel), confocal images at time 0 (center panel), and the corresponding kymographs (right panel) of the ZLS (A), the podosome belt (B), the podosome ring (C), and the podosome cluster (D) are shown. In the left panel, each actin structure in an osteoclast (gray solid line) is depicted by the arrangement of the actin cores (green dots). Time series confocal images were acquired in the area indicated by the black dotted line box. White dotted line boxes in the center panel indicate the area selected to generate the kymographs. The actin flow rate was determined by dividing the distance of EGFP-actin movement (L) by the elapsed time (T) in a kymograph. Scale bars: 5 µm. (E) Histogram of retrograde actin flow rate (n=140). The distribution of the flow rates was fitted with a quartic curve. (F) Comparison of the actin flow rate in a given cell (□) and the opposing cell (▪) in the ZLS. Flow rate was determined from 10 different actin flows from a single kymograph. Data are mean±s.d. The flow rate in a given cell was not significantly different from that of the opposing cell in five ZLS (P>0.05, paired t-test). (G) Oscillation of EGFP-actin fluorescence in the ZLS. Left panel, four regions of interest (ROIs) were placed in symmetrical positions between the two cells and in a distant location in the same cell. The number of ROIs was arbitrary. Right panel, time-lapse recordings of the EGFP fluorescence from the four ROIs.

