Fig. 3.
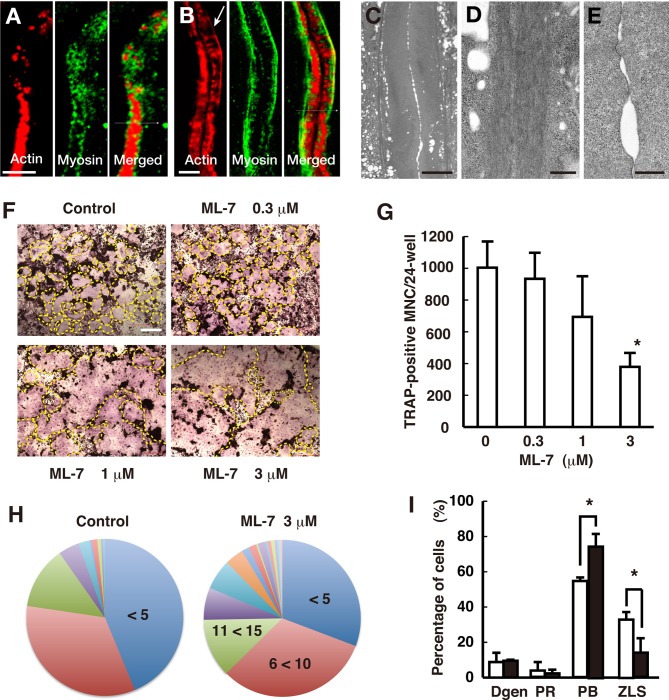
Distribution of non-muscle myosin IIA in the ZLS and its role in osteoclast fusion. Osteoclasts were stained with rhodamine-phalloidin (red) and an anti-non-muscle myosin IIA antibody (green). (A) Confocal image of the podosome belt. (B) Confocal image of the ZLS. The arrow indicates the line of F-actin that overlaps with non-muscle myosin IIA. (C) An image of the ZLS acquired via transmission electron microscopy. (D) Magnified view of the bundles running along the ZLS. Numerous parallel-running thin filaments were observed in the bundle. (E) Magnified view of the cell contact site in the ZLS. Thin filaments were rarely observed. (F) Images of TRAP-stained osteoclasts. The outline of an osteoclast is indicated by a yellow dashed line. (G) Effect of ML-7 on the formation of TRAP-positive multinucleated cells. Data are mean±s.d. (n=3). *Significantly different from the control, P<0.05, paired t-test. (H) Pie charts of the number of nuclei per osteoclast. Treatment with ML-7 (3 µM) resulted in larger osteoclasts than the control (control, n=256; ML-7, n=257; P<0.001, Mann–Whitney two-tailed test). (I) Effect of ML-7 on actin structures in osteoclasts. Osteoclastogenesis was performed in the absence (□) and presence (▪) of 3 µM ML-7. Fixed cells were stained with rhodamine-phalloidin. Osteoclasts were classified into four types: cells that had degenerated actin structures (Dgen); cells that had the podosome ring (PR); cells that had the podosome belt (PB); and cells that had the ZLS. More than 100 osteoclasts were counted per experiment. Data are mean±s.d. (n=3). *Significantly different from the control, P<0.05, paired t-test. Scale bars: 5 µm in A,B; 10 µm in C; 500 nm in D,E; 200 µm in F.

