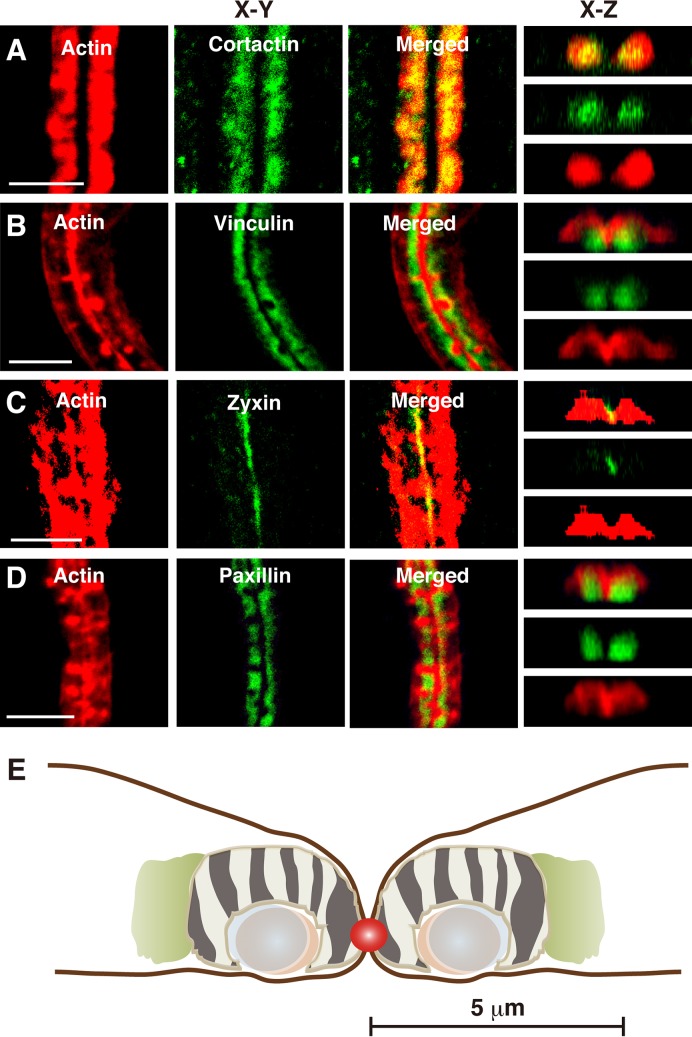
Fig. 4.
Distribution of podosomal proteins in the ZLS. Osteoclasts were stained with rhodamine-phalloidin and an anti-cortactin antibody (A), anti-vinculin antibody (B), anti-zyxin antibody (C) or anti-paxillin antibody (D), and imaged via confocal microscopy. Images shown are in the xy-plane and xz-axis. Scale bars: 10 µm. (E) Schematic representation of the ZLS. The image was generated based on measurements of the dimensions of each podosomal protein from confocal images, as described in the Materials and Methods. Data are presented in Table S1. F-actin, off-white; non-muscle myosin IIA, light green; paxillin, pale blue; vinculin, light brown; podosome-like dots and stripes, zebra pattern; zyxin, red. Scale bar: 5 µm.

