Fig. 1.
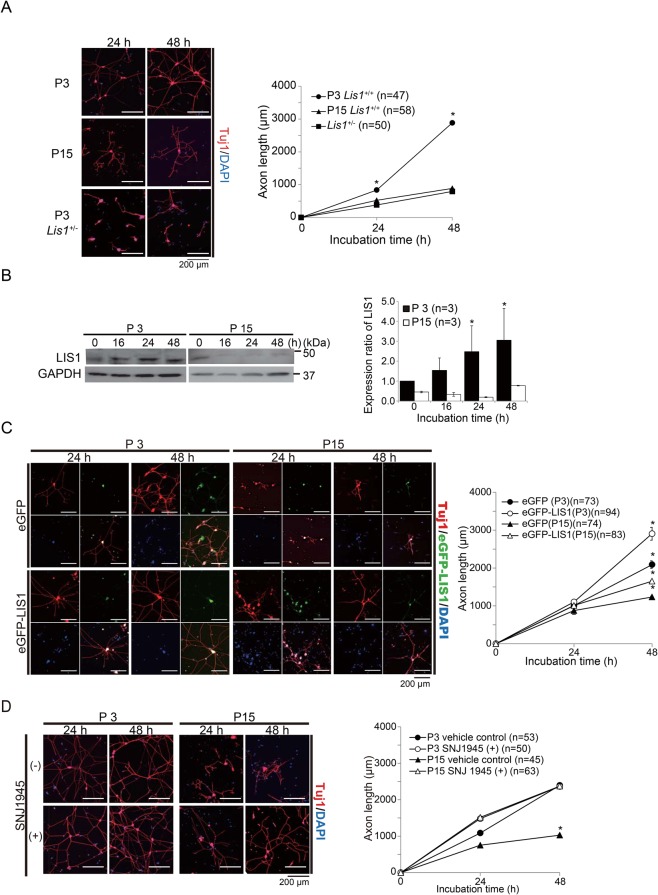
Age-dependent reduction of axonal extension in DRG neurons. (A) Age-dependent downregulation of axonal extension capacity in DRG neurons. Cultures of DRG neurons were isolated from P3 and P15 Lis1+/+ (wild-type, WT) and Lis1+/− mice and visualized by Tuj1 immunostaining (red) 24 and 48 h after plating. Nuclei were counterstained with DAPI (blue). Left panels: representative images. Axon length was defined as the summation of all axonal projections including branches. Right panel: average axonal length for each genotype and age with time after plating. Symbols indicate mean axonal lengths with standard errors (mean±s.e.). DRG neurons from Lis1+/+ mice show an age-dependent reduction in axonal extension capacity, while P3 DRG neurons from Lis1+/− mice exhibit limited axonal extension capacity of older (P15) Lis1+/+ neurons. Numbers of neurons examined are indicated in brackets. *P<0.05 by analysis of variance (ANOVA). (B) Left panel: age-dependent LIS1 downregulation in cultured Lis1+/+ DRG neurons as revealed by western blotting. GAPDH was used as the internal control. Right panel: relative intensities from densitometric analysis. The zero-time LIS1/GAPDH ratio of P3 Lis1+/+ neurons is defined as 1.0. LIS1 expression is much lower in Lis1+/+ P15 DRG neurons. *P<0.05 by ANOVA. Error bars indicate standard errors. (C) Effect of exogenous LIS1 expression on axonal extension. DRG neurons from P3 and P15 Lis1+/+ (WT) mice were transfected with eGFP-Lis1 or empty vector (eGFP). Left panels: representative images. Right panel: quantitation. LIS1 overexpression enhanced axonal extension of DRG neurons at both P3 and P15 compared to age-matched controls (empty vector group). *P<0.05 by ANOVA. Error bars indicate standard errors. (D) Effect of the calpain inhibitor SNJ1945 on axonal extension. Left panels: representative images. Right panel: quantitation. SNJ1945 enhanced axonal extension of Lis1+/+ P15 DRG neurons compared to age-matched vehicle-treated controls but had no effect at P3. *P<0.05 by ANOVA. Symbols indicate mean axonal lengths with standard errors (mean±s.e.).

