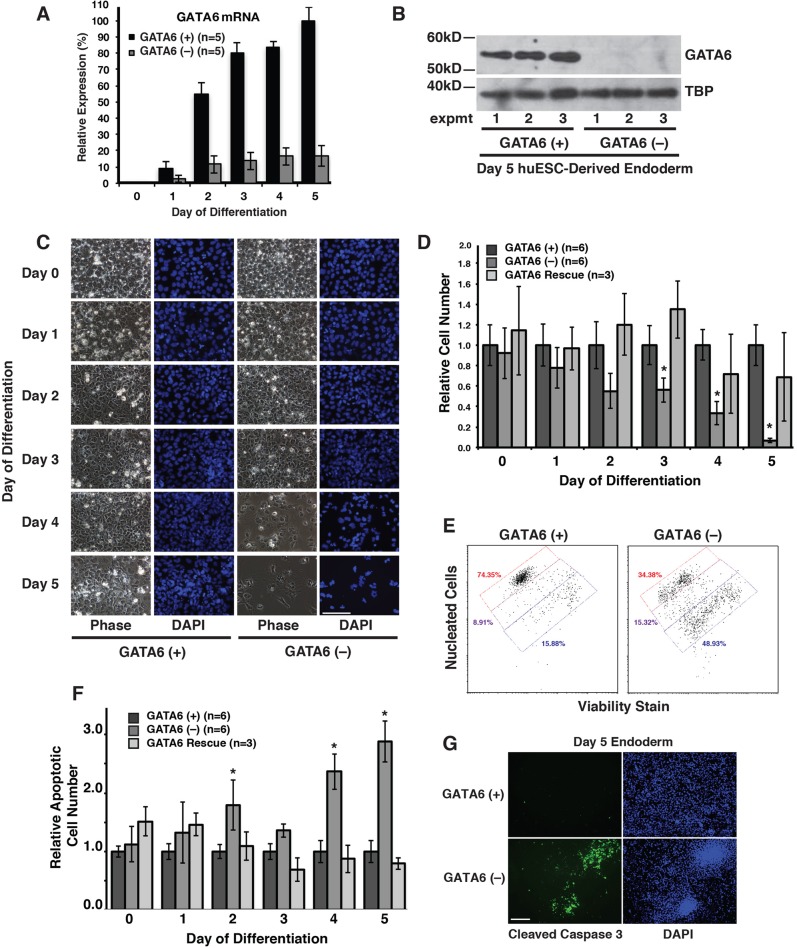
Fig. 2.
GATA6 depletion induces apoptosis of definitive endoderm. (A) Bar graph showing the results of RT-qPCR analysis of control ESCs [GATA6 (+)] and ESCs expressing a GATA6 shRNA [GATA6 (−)] collected daily during endoderm differentiation (days 0–5). Error bars represent standard error of the mean for five independent differentiations. (B) Immunoblot analysis performed on nuclear extracts from control and GATA6-depleted cells harvested at day 5 of endoderm differentiation (n=3 independent differentiations). TBP was used as a loading control. (C) Micrographs showing phase-contrast imaging and DAPI staining of GATA6 (+) and GATA6 (−) pluripotent (day 0) or differentiating endoderm cells (days 1–5). Images shown are representative of three independent differentiations. Scale bar: 100 μm. (D,F) Bar graphs showing the results of flow cytometry to identify total cell number (D) and apoptotic cell number (F) during the differentiation of GATA6 (+) (n=6 independent differentiations), GATA6 (−) (n=6 independent differentiations), and GATA6–shRNAindFlagGATA6 (GATA6 Rescue; n=3 independent differentiations) cells. Error bars represent standard error of the mean and significance was determined using Student's t-test; *P<0.05. (E) Representative flow cytometry dot plot for one group of day 4 samples showing gating conditions for live nucleated cells (viability dye excluded, red gate), apoptotic (viability dye low, purple gate), and dead enucleated cells (viability dye high, blue gate). (G) Micrographs showing immunostaining to detect the level of the activated Caspase-3 in GATA6 (+) and GATA6 (−) cells at day 4 of differentiation. Images are representative of two independent differentiations. Scale bar: 100 µm.

