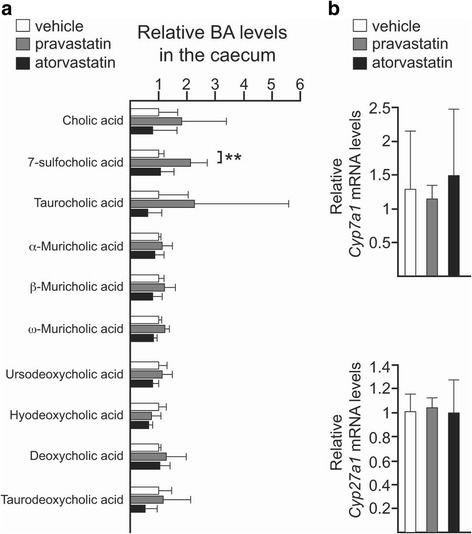
Fig. 5.

PXR activity regulates the changes in the BA pool of the gut induced by statins. a Relative levels of the indicated primary and secondary bile acids in the gut of Pxr −/− mice control (white) or mice treated with pravastatin (grey) or atorvastatin (black) and fed with ND. Bars represent the mean ± SD calculated from at least four biological replicates. b Relative expression in the liver of Cyp7a1 and Cyp27a1 by qPCR. Barplots represent the mean ± SD determined from three biological replicates. **P ≤ 0.01; one-way ANOVA followed by Dunnett’s post hoc test
