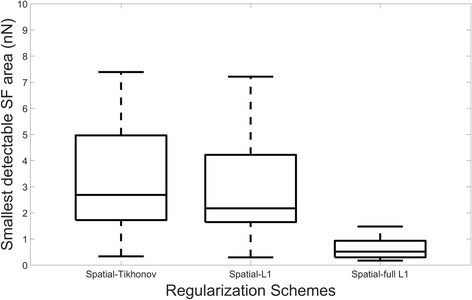
Fig. 6.

Comparison of the smallest detectable stress footprint areas (nN) for different regularization schemes. Ten different traction maps have been considered and ten realizations have been computed for each of them. All the differences are statistically significant (Student’s t-test, p < 0.005), except between Tikhonov and L1-regularization (p = 0.5)
