
Fig. 8.
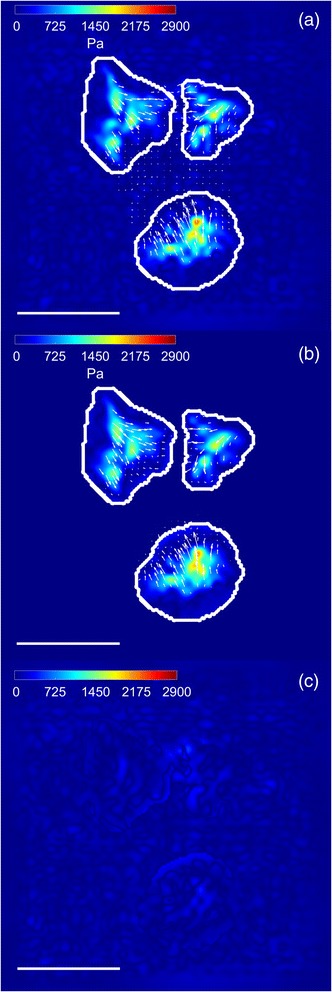
Comparison between spatial and Fourier Domain. Traction field magnitude (in Pa) and direction (arrows) from a real cell using L2-regularization: a Spatial domain; b Fourier domain. The outline of the mask used for traction recovery in the spatial domain is shown in white. c Absolute value of the difference between recovered tractions in (a) and (b). The scale bar represents 30 μm