
Figure 2.
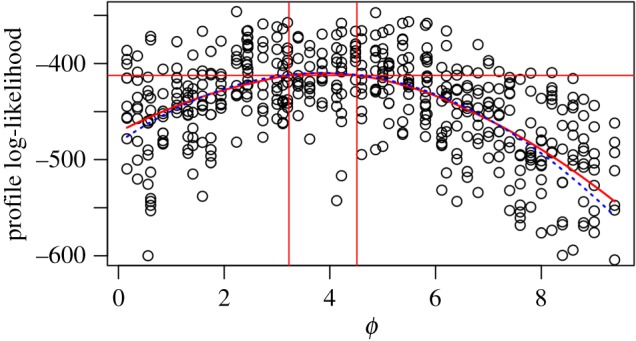
Profile likelihood for an infectious disease transmission parameter inferred from genetic data on pathogens. The smoothed profile likelihood and corresponding MCAP 95% CI are shown as solid red lines. The quadratic approximation in a neighbourhood of the maximum is shown as a blue dotted line. (Online version in colour.)