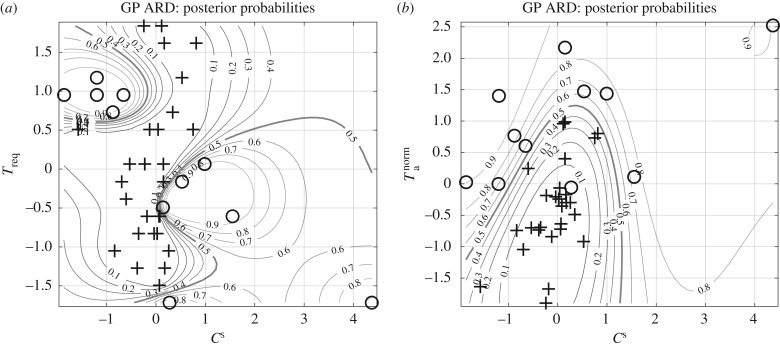
Figure 11.
(a,b) Posterior probability plots of Gaussian process—automatic relevance determination (ARD). The two plots show the posterior probability contours given the most important features estimated by GP-ARD from fig. S2: Cs, Treq and Tnorma. The plus symbols correspond to healthy volunteers and the circles to patients with MI. The decision boundary of 0.5 is highlighted with a thick grey line.

