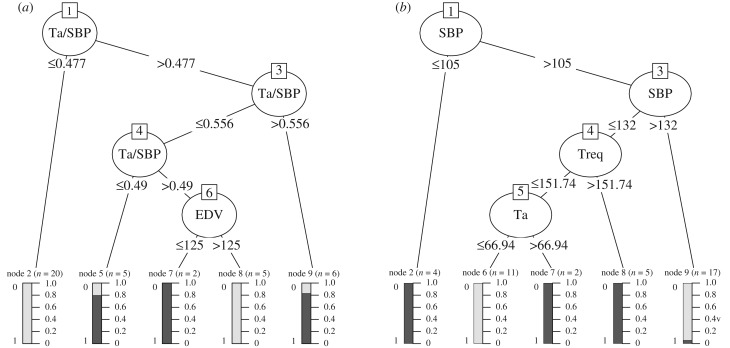
Figure 8.
(a,b) C5.0 Decision-Trees for the different datasets D1 (a) and D2 (b). Note that only the first tree for each dataset is shown from an ensemble of boosting trees. The decision tree is the same for dataset D3 as dataset D1 because the same features are selected for the splits, thus not shown here. The selected C5.0 parameters for tree construction are based on the error rate evaluation in electronic supplementary material, figure S7.

