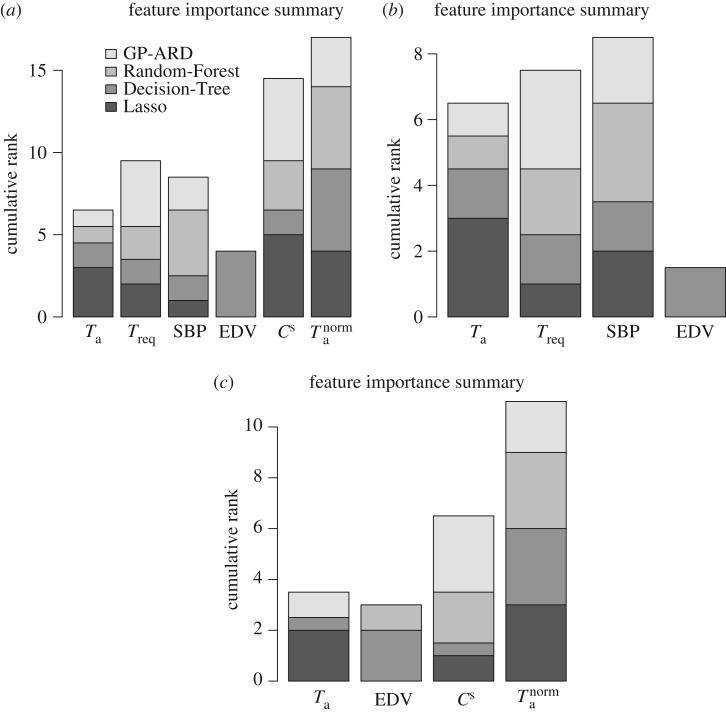
Figure 9.
(a–c) Summary of feature relevance scores, obtained with different statistical/machine learning methods. The features are separately ranked in ascending order of importance, taken from the set {0, 1, …, p − 1}, where p is the total number of features. The ranks are accumulated over all methods shown in the legend. These methods are represented by different grey shades in the bars. A higher rank indicates a more important feature. The three panels correspond to the three datasets used in our study; from left to right: D1, D2 and D3.

