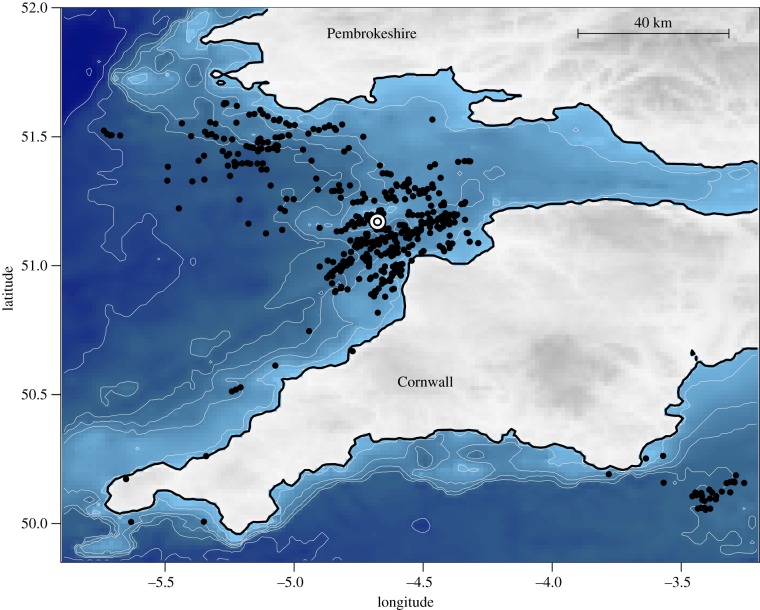
Figure 1.
The distribution of Manx shearwaters foraging around Lundy Island (white circle), tracked between 12 and 25 August 2012 (n = 7). Black points denote 60 s bursts of tracked movement (n = 475) and are shown relative to the underlying bathymetry, accessed from National Oceanic and Atmospheric Administration (NOAA) via marmap [39].

