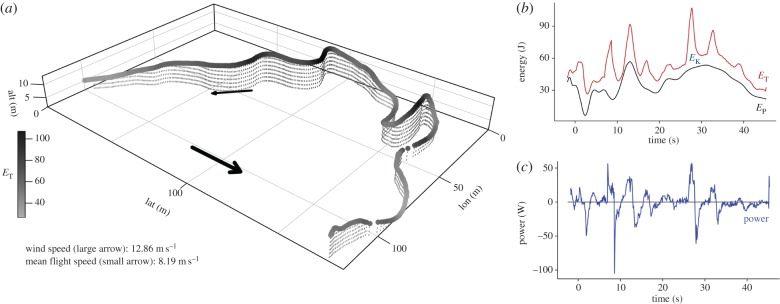
Figure 2.
A high-frequency GPS flight burst. The bird's three-dimensional path through space (a) is shown with track shaded by total mechanical energy (ET), with arrows showing wind direction (large) and flight direction (small). Separate graphs show mechanical energy components ET, EP and EK (b) and power (c) against time. This burst contains both low-power flapping and spikes in power suggesting wind energy input.

