Figure 3.
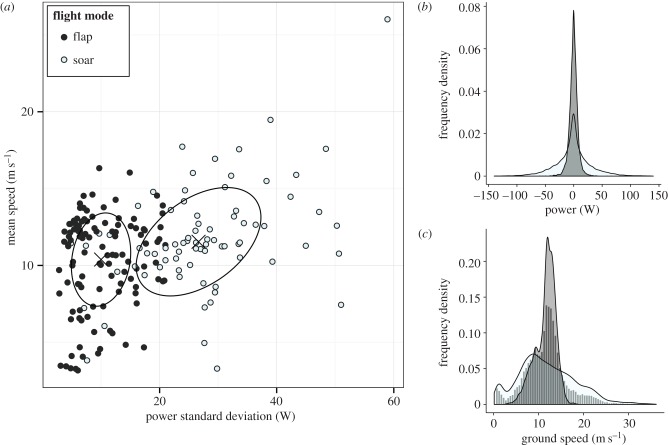
Energetic characteristics of flap-like and soar-like flight. (a) Relationship between burst summary parameters power variance and mean speed, with ellipses showing modelled Gaussian components (mean + s.d.). Density curves show within-burst distributions of fine-scale power (b) and ground speed (c) for flap-like (grey) and soar-like flight (white), produced by combining 10 Hz points from all bursts classified to either mode with over 95% probability. The distribution of ground speeds across all flight bursts (both flap-like and soar-like) was trimodal (histogram in c). (Online version in colour.)

