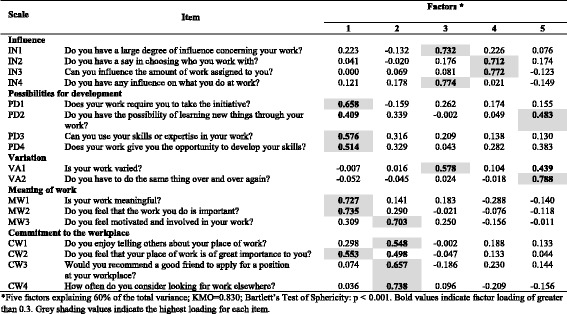
Table 6.
Exploratory factor analysis of items in the Work organisation and job contents dimension (n = 699) of COPSOQ II (long version): loadings for each factor and each item in the scale after a varimax rotation and factor extraction using principal components

*Five factors explaining 60% of the total variance; KMO = 0.830; Bartlett’s Test of Sphericity: p < 0.001. Bold values indicate factor loading of greater than 0.3. Grey shading values indicate the highest loading for each item
