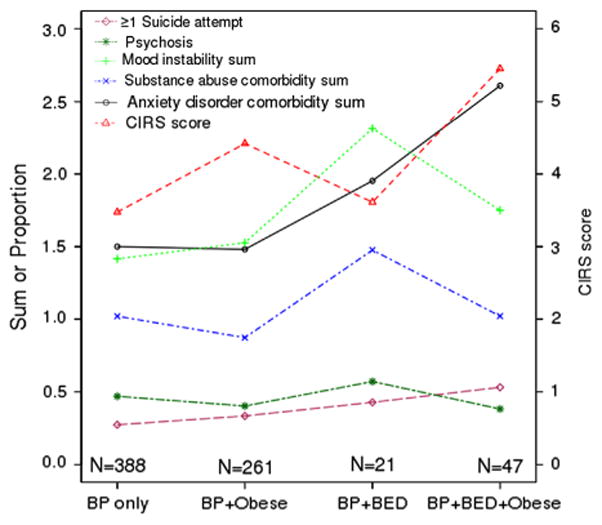
Fig. 1.

Means and proportions of illnesses burdens by BED and obesity phenotypes. For each psychiatric burden measure, the proportion (suicide, psychosis) or mean score (mood instability, anxiety disorder comorbidity, substance abuse comorbidity) is plotted using the left-side y-axis, for patients in the four groups defined along the x-axis: BP without BED or obesity, BP with obesity only, BP with BED only, and BP with both BED and obesity. To demonstrate general medical burden in the four groups, the mean CIRS score is plotted for each group using the right-side y-axis.
