
Fig. 3.
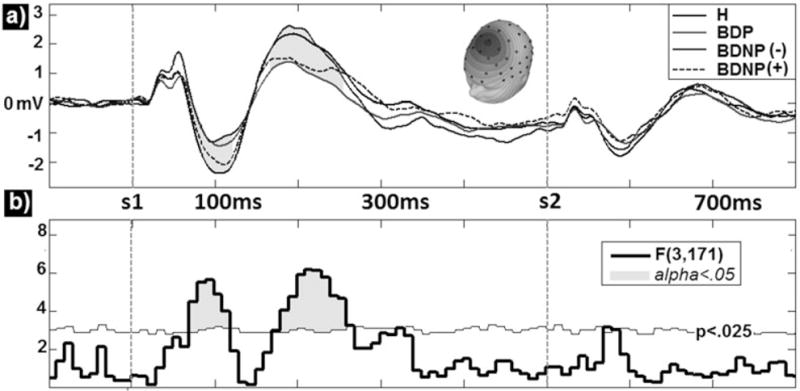
Group comparisons for principal components analysis derived event-related potentials waveforms for oddball standard stimuli (A) averaged within group yield significant effects in the N1, P2, and late N2 time ranges (shaded regions). F-values for these effects are also presented along with (B) a bootstrapped p < 0.025 probability line (thin horizontal line). Time regions reaching significance at FWalpha< 0.05 are highlighted. H = healthy comparison subjects; BDP = bipolar disorder with psychosis; BDNP(−) = bipolar disorder without psychosis without first-degree family history of psychosis; BDNP(+) = bipolar disorder without psychosis with first-degree family history of psychosis.