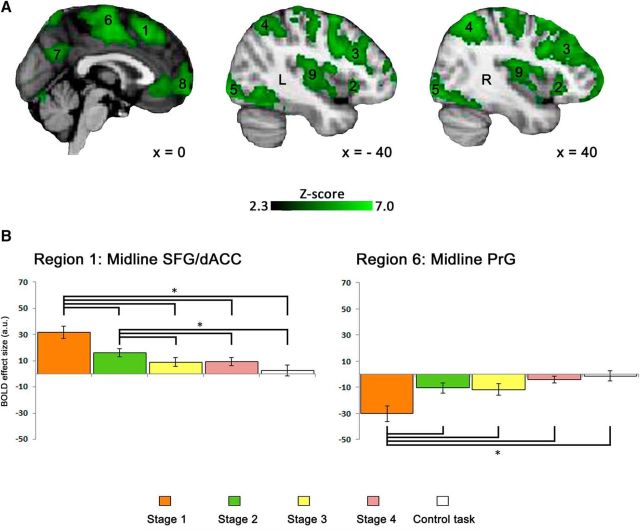
Figure 5.
A, Group level z statistic map of all regions showing the learning stage effect overlaid on an anatomical template. Results were obtained using familywise error correction at p < 0.05 and cluster-forming threshold at Z > 2.3. B, Bar plots for the BOLD signal across the four learning stages during the novel vocabulary learning task and the control task recorded for the midline SFG/dACC (left) and PrG (right). Error bars represent SEM. *p < 0.005.

