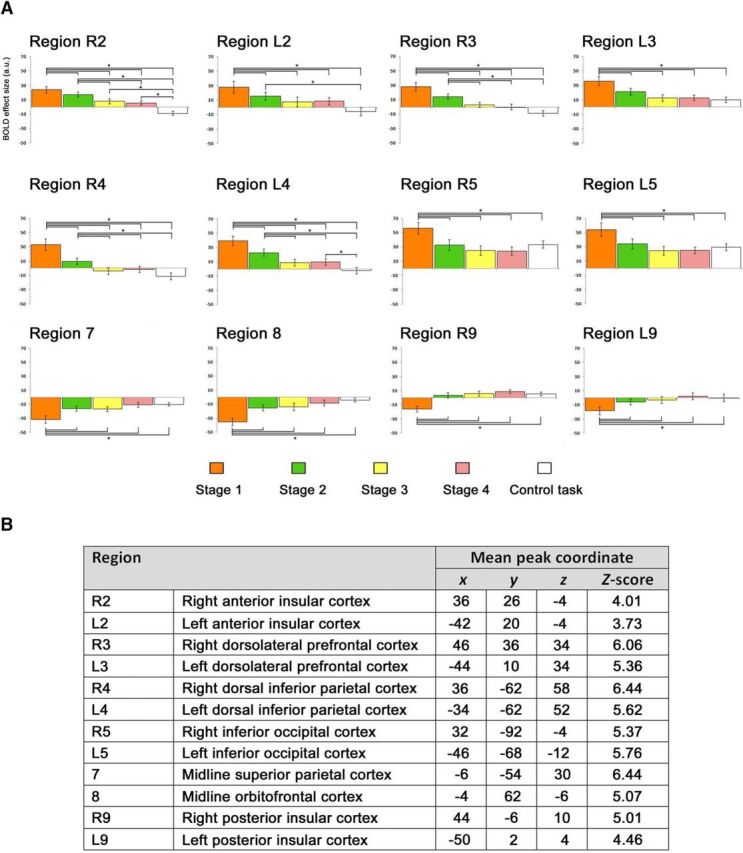
Figure 6.

A, Bar plots for the BOLD signal across the four learning stages during the novel vocabulary learning task and during the control task recorded for the regions that were not presented in Figure 5. Error bars represent SEM. *p < 0.005. B, The standard space (MNI) coordinates of the peak voxel and the Z-score for the regions presented in A.
