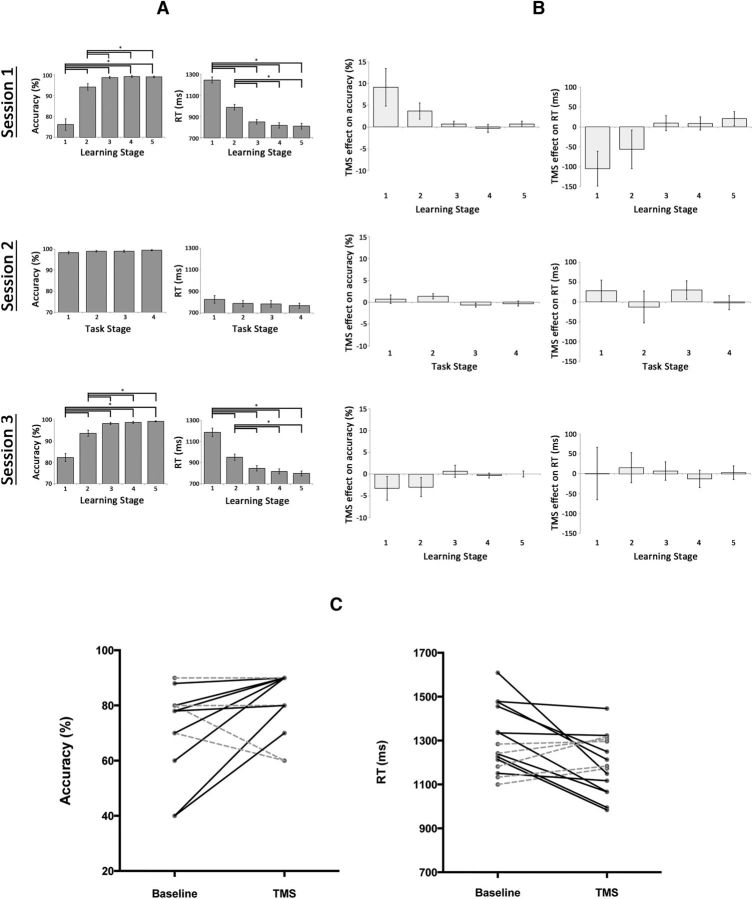
Figure 7.
A, Mean group accuracy (left) and RT (right) during the novel vocabulary learning task in TMS Sessions 1 and 3, and the control real word–object matching task in Session 2. Error bars reflect SEM. *p < 0.02. B, TMS effects on accuracy (left) and RT (right) represented as the difference between TMS and no TMS trials per learning/task stage for each session. Error bars represent SEM of the stimulation effect across individuals. C, Individual stimulation effects during the first learning stage in Session 1. Continuous black lines indicate improved performance, whereas dashed gray lines unchanged or worsen performance.

