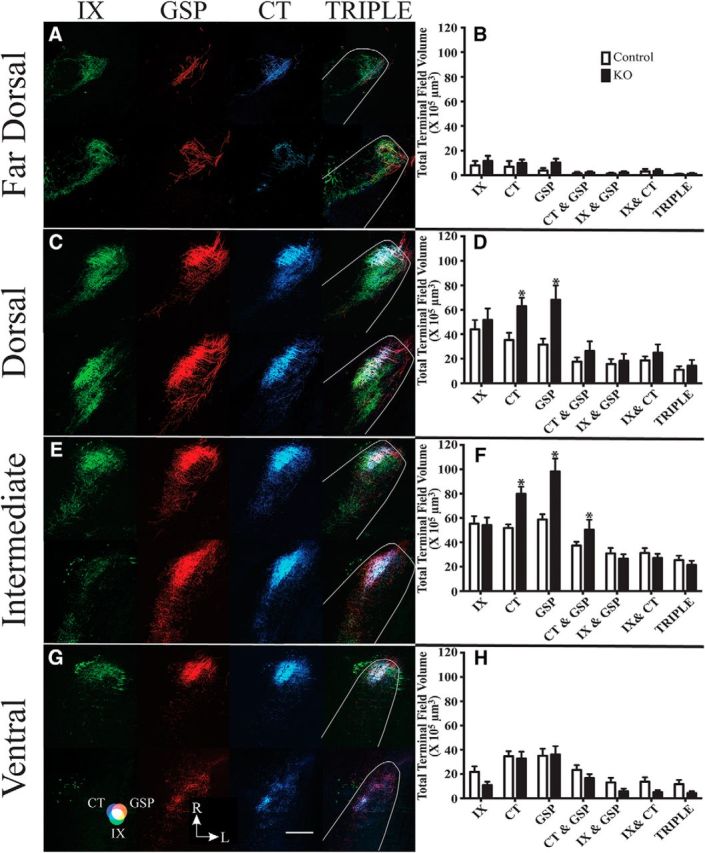
Figure 5.

Horizontal sections of labeled terminal fields of IX (green), GSP (red), CT (blue), and merged images of all three nerves (TRIPLE) for control (top row of each panel) and αENaC KO mice (bottom row of each panel) mice in the far dorsal (A), dorsal (C), intermediate (E), and ventral (G) zones within the mouse NST. Magenta represents the CT-GSP overlap. Yellow represents the IX-GSP overlap. Blue-green represents the IX-CT overlap. White represents the CT-GSP-IX terminal field overlap. G, Color guide. Scale bar: G, 200 μm. R, Rostral; L, lateral shown in G. Mean (± SEM) terminal field volumes of IX, CT, and GSP nerves and their overlapping fields in the far dorsal (B), dorsal (D), intermediate (F), and ventral (H) zones in control (open bars) and KO (filled bars) mice. Asterisks shown for terminal field volumes indicate a significant difference between controls and αENaC KO mice (p < 0.05).
