Figure 3.

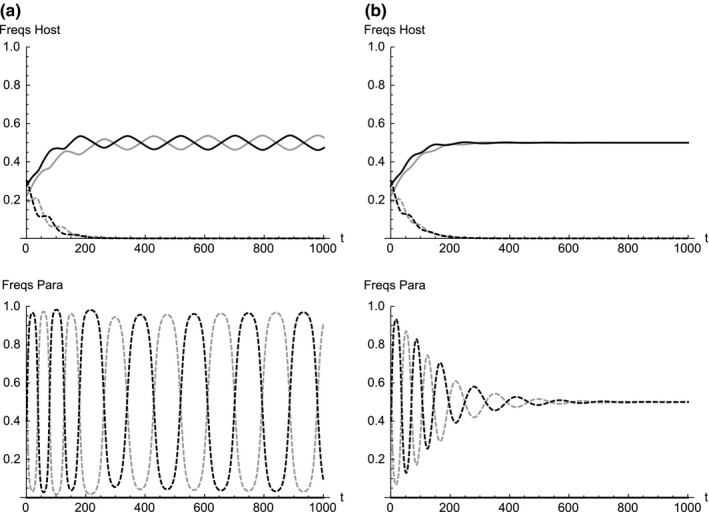
Frequency dynamics in which immaculate white and blue eggs are completely absent in the parasite population (p 1 = p 2 = 0) and no mutation occurs in spottiness m s = 0. Frequencies in the host (top) and the parasite (bottom). Probability of mutation in color is (a) m c = 1.0 × 10⁻⁴ and (b) m c = 4.0 × 10⁻³. Initial frequencies are set arbitrarily as (h 10, h 20, h 30, h 40) = (0.225, 0.275, 0.2, 0.3) and (p 10, p 20, p 30, p 40) = (0, 0, 0.3, 0.2). Other parameters used are A 0 = 0.8, A c = A s = 0.1, A cs = 0.01, and p = 0.05. Immaculate white, immaculate blue, white with spots and blue with spots is shown in solid gray, solid black, dashed gray and dashed black, respectively
