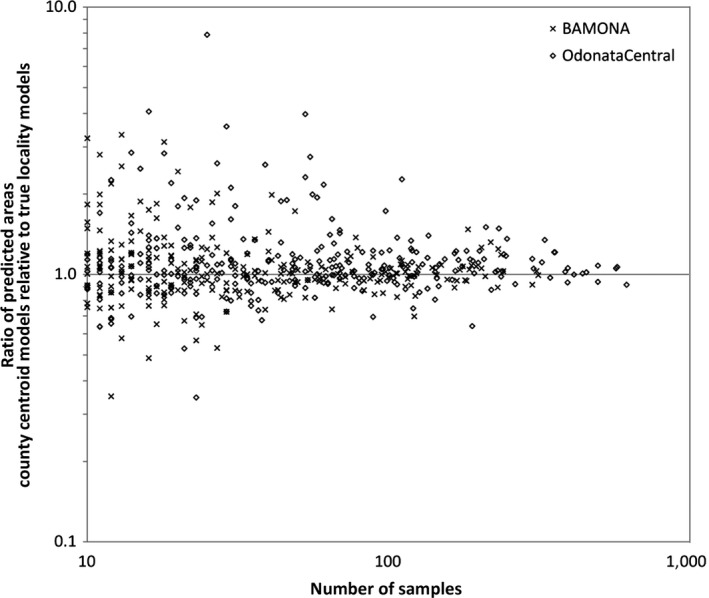
Figure 6.

The discrepancy in predicted area using US county centroids relative to true localities is greatest for species with few locality records, using the minimum‐training‐presence threshold for predicted area assuming a default value of prevalence. “x” = data from BAMONA, “o” = data from OdonataCentral
