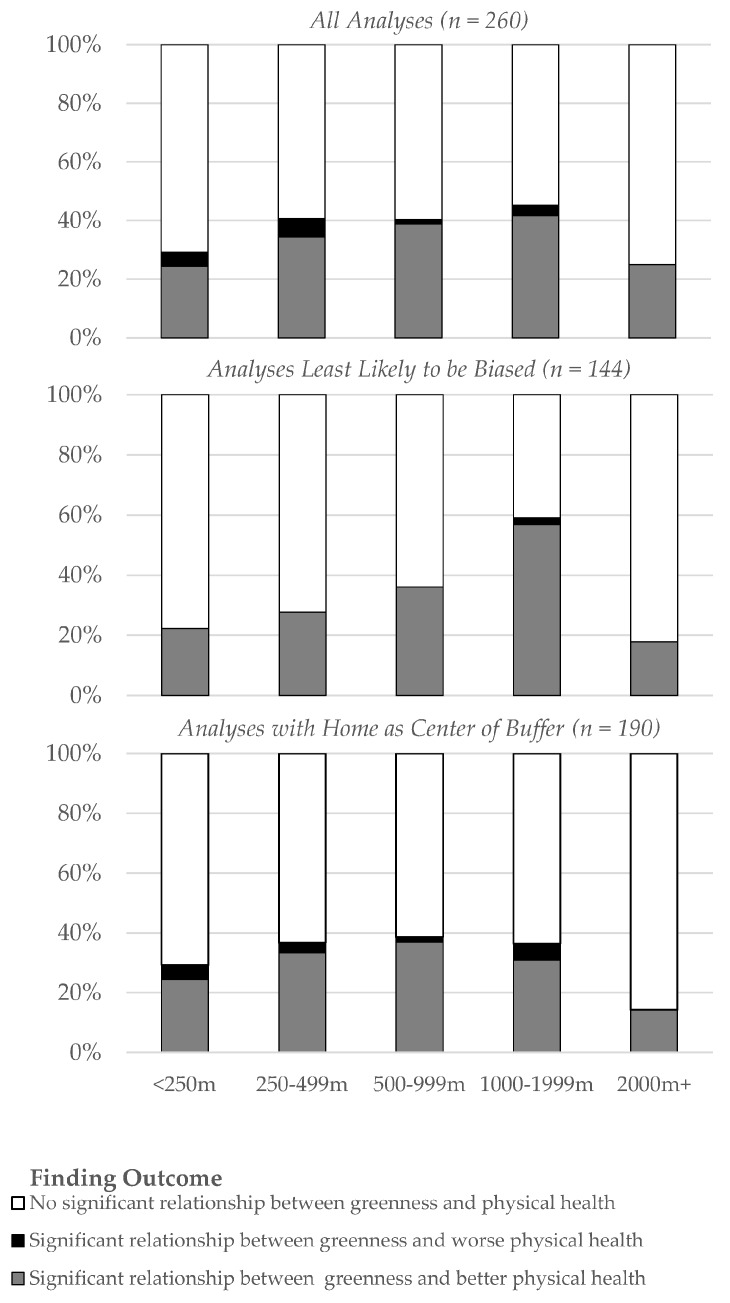
Figure 5.
Percent of analyses showing statistically significant relationships between greenness and physical health improvement increases as buffer size increases, but only to a point. In all analyses reviewed (top), the percent of significant findings increased up to 1000–1999 m buffers, but then decreased at larger buffer sizes. This trend was exaggerated when examining only those analyses least likely to be biased (middle), as indicated by their use of objective health measures and the inclusion of income or education as a confounding factor. Analyses that used buffers centered on home addresses—rather than postal codes or census tracts—showed a different tipping point (bottom). In this subsample, analyses demonstrated that greenness improves physical health in buffers up to 500–999 m in size—not 1000–1999 m.

