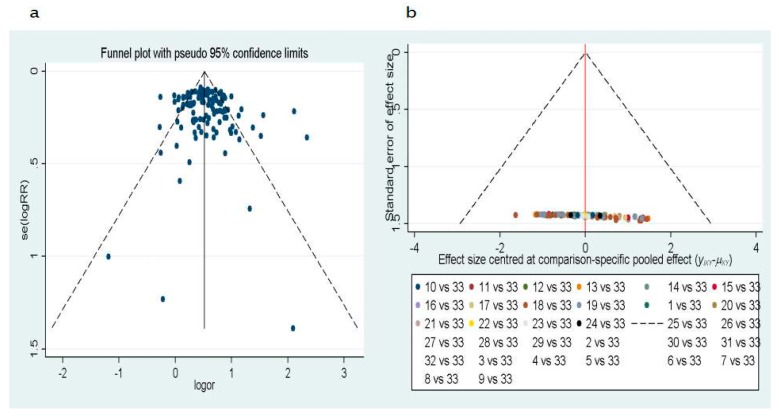
Figure 4.
Funnel plot of the publication bias (a) from Deeks’ test, the data is based on the article of cases and controls. (b) From Egger’s test, the data is based on the article indirect comparisons of methylated gene for 1–32 (1/CDH1, 2/SOX17, 3/CDO1, 4/ZFP42, 5/TAC1, 6/H-cadherin, 7/FHIT, 8/PCDH20, 9/Dab2, 10/Dcr2, 11/SULF2, 12/Kifla, 13/Dal-1, 14/Jph3, 15/RASSF2, 16/TCF2l, 17/CXCL, 18/MAGE, 19/HOXA, 20/RARβ, 21/FAM19A4, 22/PHACTR3, 23/DAPK, 24/3OST2, 25/PRDM14, 26/GATA, 27/MGMT, 28/PAX5, 29/CYGB, 30/APC, 31/p16, 32/RASSF1A) and 33/the gold standard of being diagnosed with lung cancer.

