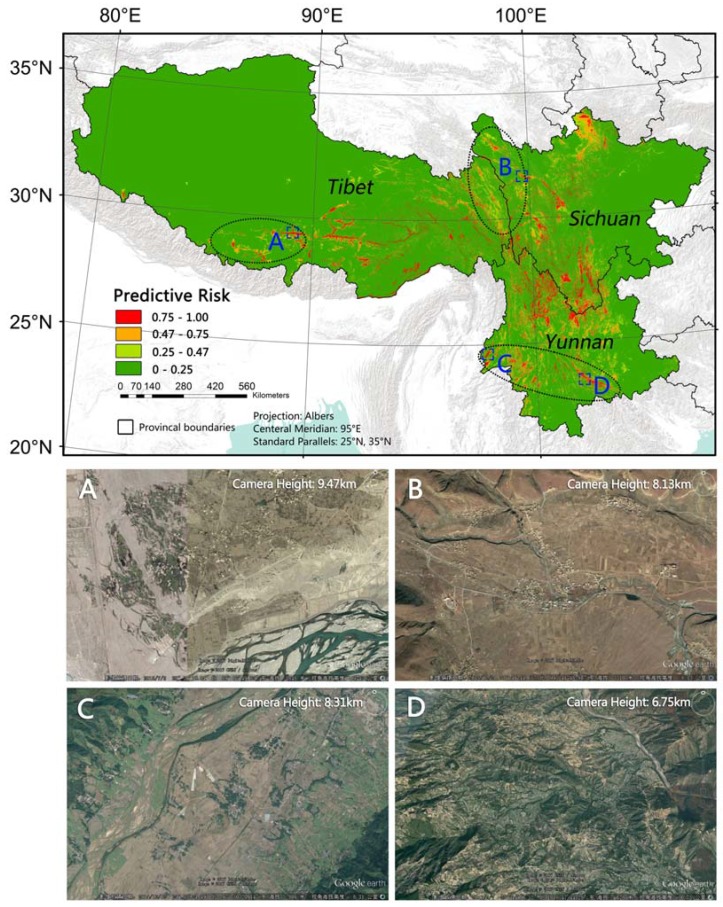
Figure 4.
Predicted high-risk patches in non-hotspot regions. (A–D are four examples of predicted high-risk patches in non-hotspot region. Residents in site A, B and C live in river valleys, residents in site D live on rugged lands. The four images are Google Earth images in corresponding sites showing the poor living conditions).

