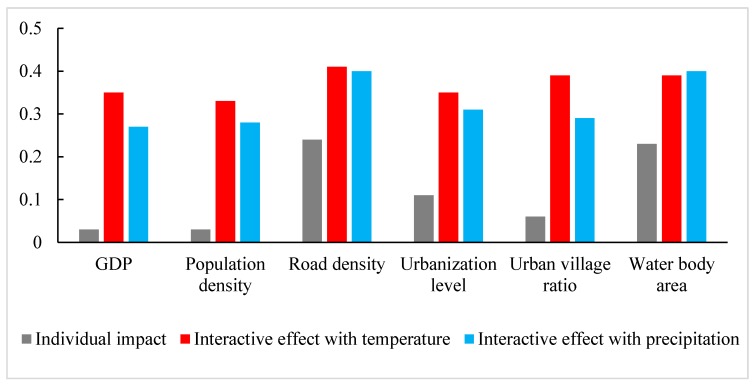
Figure 4.
Interactive impact of weather factors and other socio-ecological factors. Gray is the individual impact of GDP, population density, road density, urbanization level, urban village ratio, and water body area. Red is the interactive impact of temperature and the above socio-ecological factors. Blue is the interactive impacts of precipitation and the above socio-ecological factors. All the interactive impacts are statistically significant (p < 0.05).

