
Figure 4.
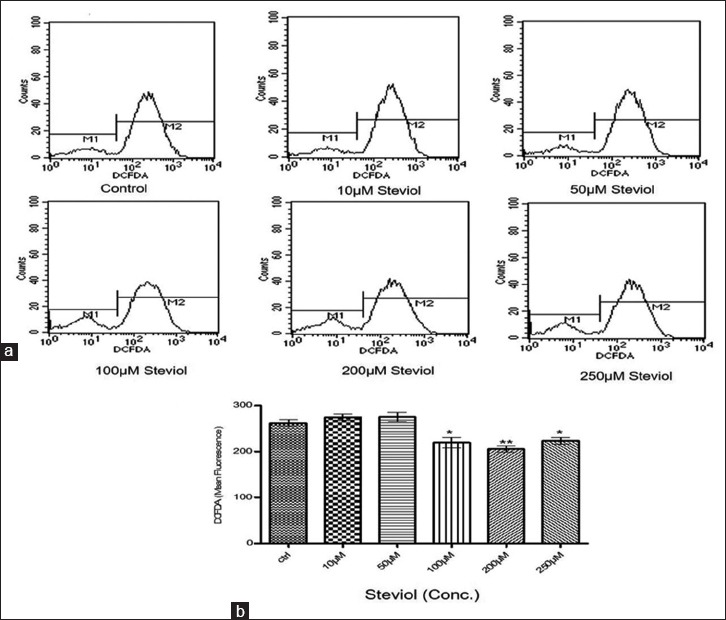
(a) MCF-7 cells (0.2 × 10⁶) were exposed in 6-well plates and exposed with 10–250 μM Steviol for 24 h. Cells were incubated with 10 μM DCFDA for 30 min in dark. Reactive oxygen species generation was detected through flow cytometry. The result signifies the deviation in curve from the control to the treated samples, (b) Graphical representation of Flow data