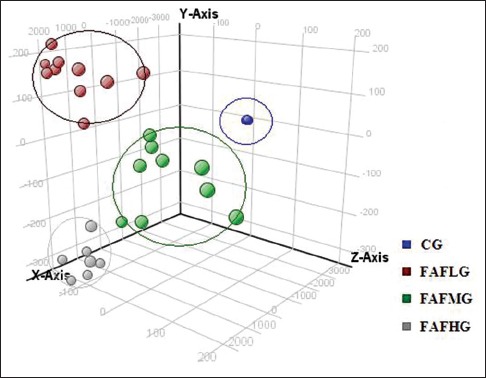
Figure 3.

Principle component analysis of each group. Each colored point represents a sample. The first, second and third principal components are displayed on the X, Y and Z-axis, respectively. These three components represent the largest fraction of the overall variability. Blue ball: Control group; brown ball: Low dose group; green ball: Middle dose group; gray ball: High dose group
